


What if you could understand exactly what five hundred attendees thought about your conference without having to ask each person individually?
Most organizers rely on assumptions and hope their event resonates with the crowd. Event analytics for conferences removes that uncertainty. It reveals how attendees behaved, what sessions attracted the most interest, where engagement peaked, and which areas need improvement.
Let’s explore how post-event data can help you make smarter decisions and create a stronger conference experience the next time around.
What Is Event Analytics in Conference Management?
Ever wondered how top-tier events look so flawless year after year? It is not luck. It is all thanks to event analytics for conferences.
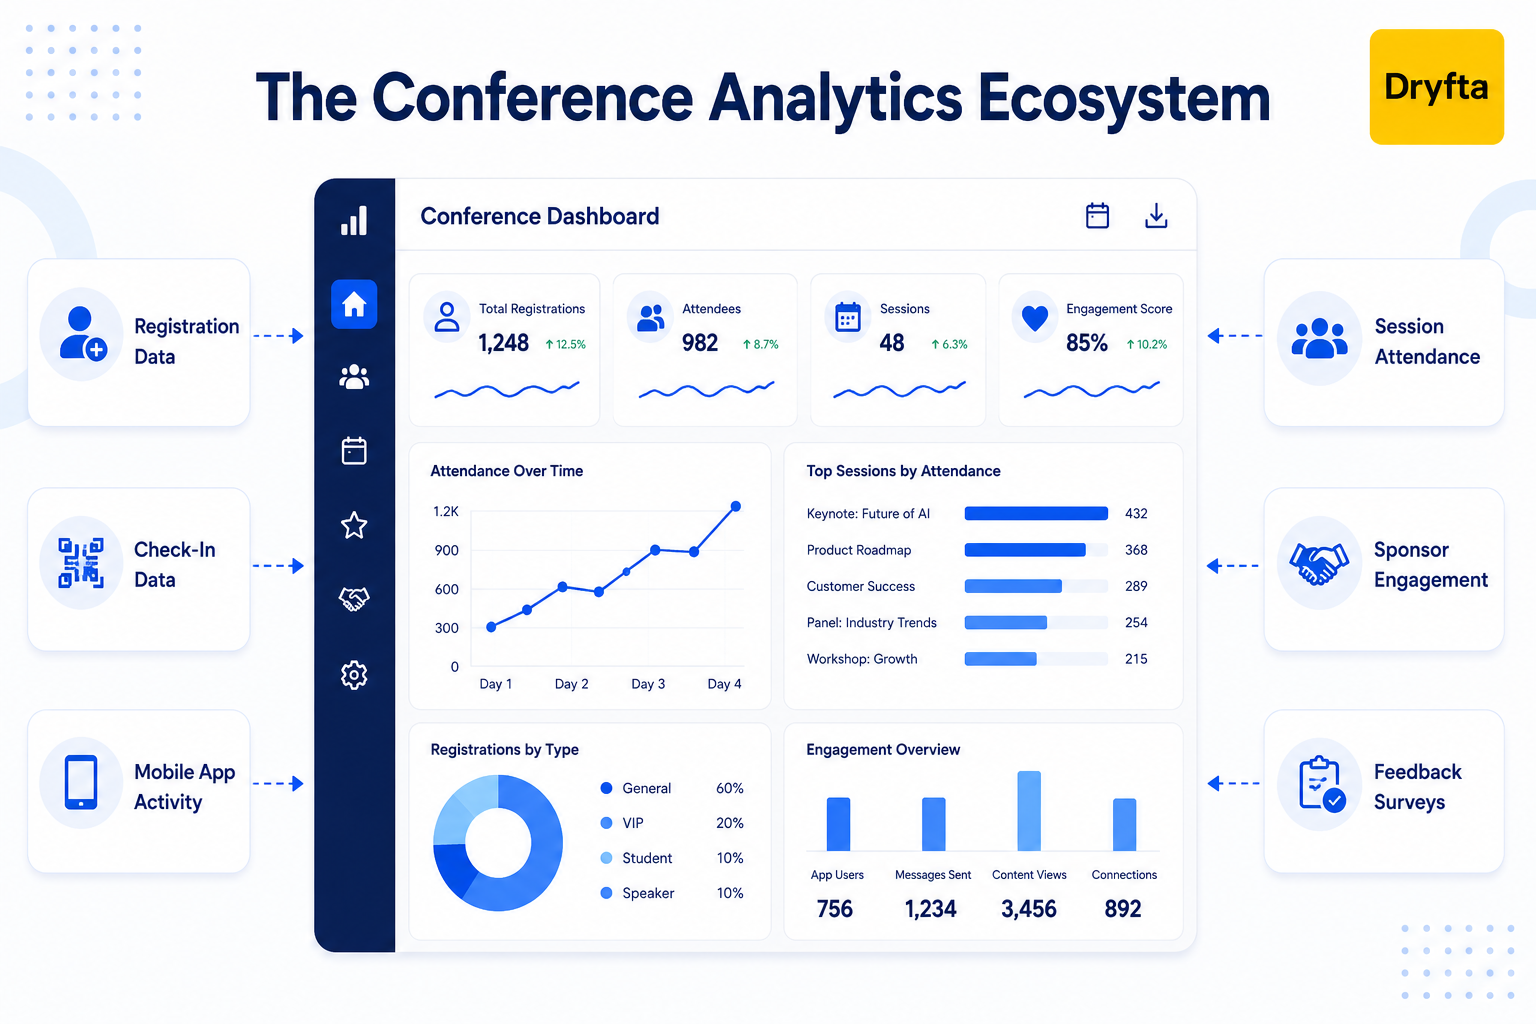
Event analytics for conferences is simply another term for looking at and analyzing all the digital footprints your attendees leave behind. We are talking about gathering data from registration systems, gate check-ins, app engagement, live feedback surveys, communication channels, sponsor lead trackers, and final reporting tools. With conference analytics in place, you can stop relying on your gut feelings and look at the solid proof of how your event truly performed.
Why Event Analytics Matters After a Conference?
You’ve wrapped up your event and said thank you to your guests. Now what?
Post-event analytics data gives you insight into what did and did not happen and why. It will take you beyond the “did they show up?” question and give you insight into the reasons why some sessions were successful and others were not. It is your ultimate reality check.
Here is why post-event analytics is a total lifesaver:
- Tracks ROI: Shows exactly where your money went.
- Demonstrates sponsor value: Provides sponsors with proof of attendee engagement.
- Identifies underlying patterns: Shows which sessions and activities had the best engagement.
- Captures genuine feedback: Catches feedback while memories are fresh.
Difference Between Reporting and Actionable Analytics
A lot of planners get this mixed up.
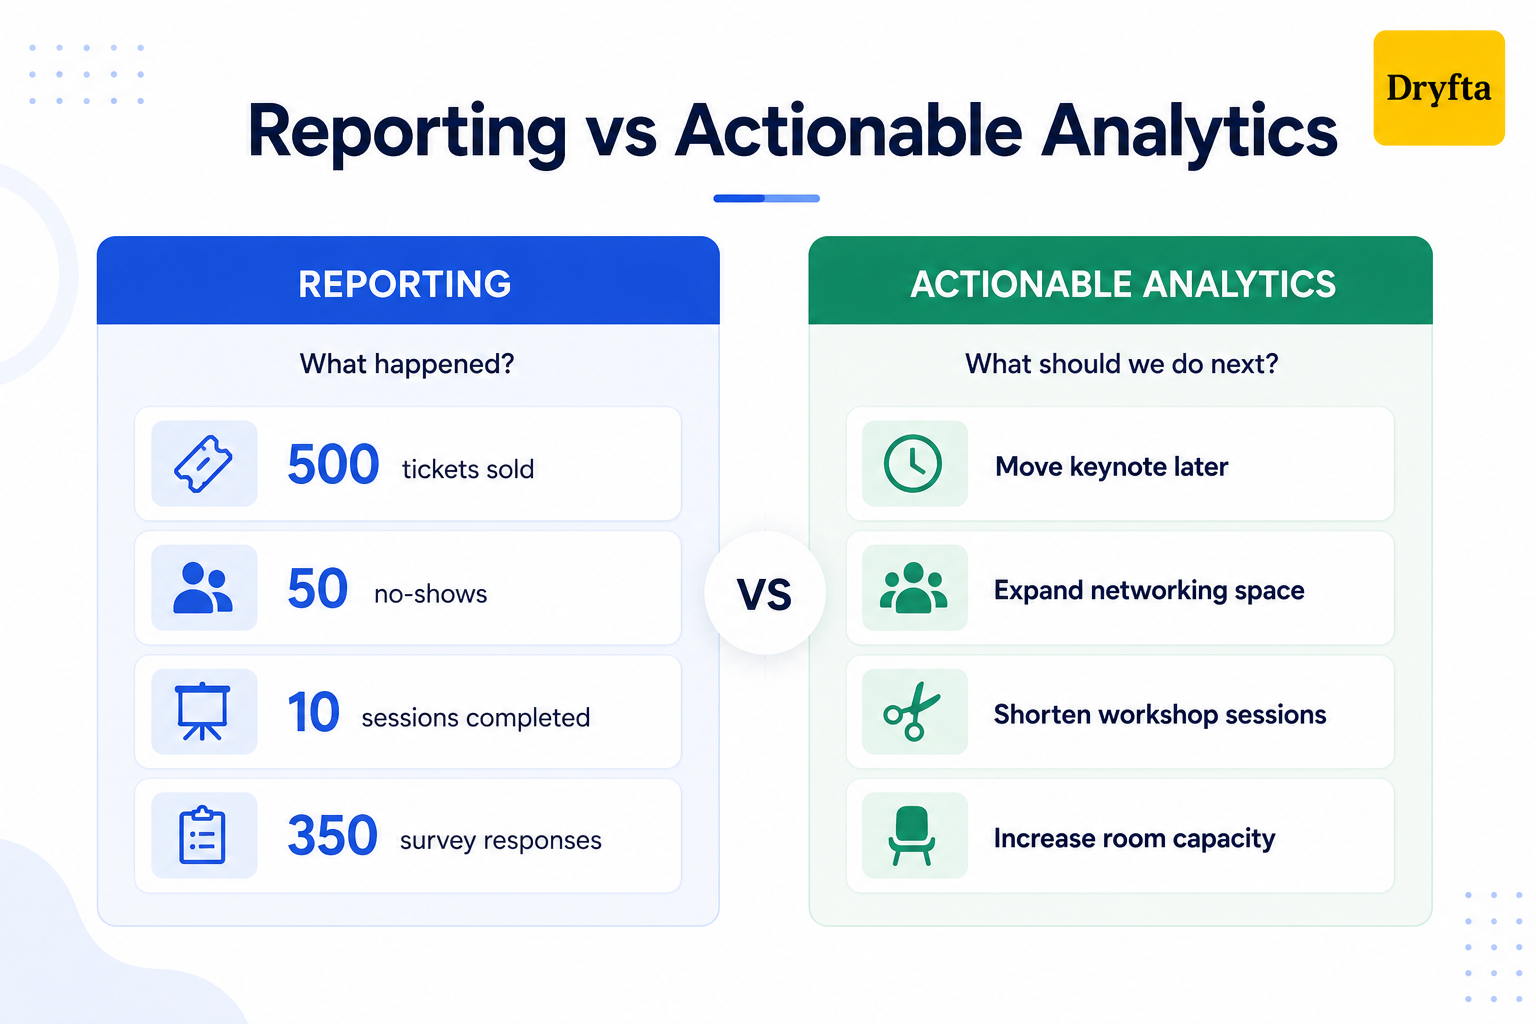
Basic reporting simply tells you what happened. It gives you raw numbers: 500 tickets sold, 50 no-shows, 10 completed sessions, and 350 survey responses. Helpful for reporting, but not for understanding your event performance.
On the flip side, the actionable conference analytics tells you what to do differently at the next conference. For example, if the data reveals that all attendees avoided the afternoon panels to network in the lobby, actionable analytics would suggest reducing the length of the speeches and creating a bigger lobby next year. It explains the reasons for 200 people leaving early, and how to make better scheduling choices next time.
Examples of Conference Analytics Data
To become an expert in event analytics for conferences, you must know what event success metrics to focus on and what they are telling you about your attendees.
Here’s a closer look at the insights you can gather:
- Total registrations, actual venue check-ins, and final no-show percentages.
- Session attendance numbers and peak room capacity times.
- Audience interaction rates from live polls and feedback surveys.
- Mobile app login rates, message counts, networking meeting requests, exhibitor page visits, and profile clicks.
- Email blast open rates and link clicks for your marketing updates.
- Sponsor lead generation numbers and booth visits.
- Final ticket revenue numbers broken down by different discount codes.
Key Conference Metrics to Review After Every Event
Your event may be over, but your event data analytics still have plenty to say. Let’s break down the metrics that reveal what resonated with attendees and what deserves a second look.
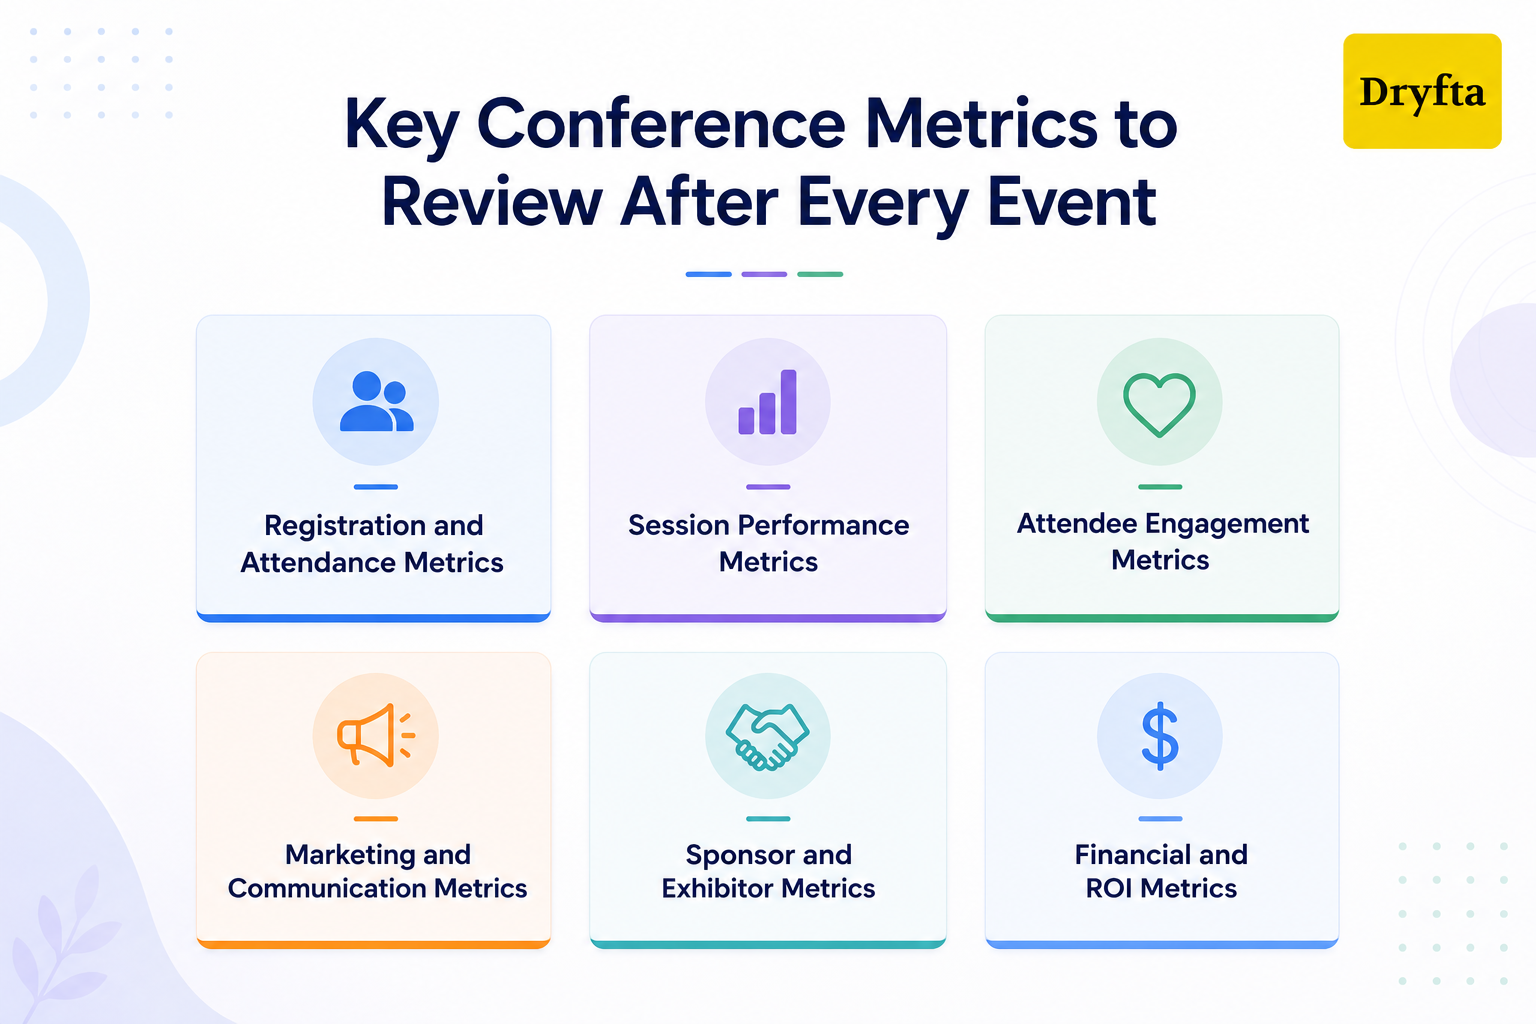
1. Registration and Attendance Metrics
Even before the first session begins, attendees are already interacting with your event. That data shows how they discovered and registered for your event.
- Track total registration volume
- Identify your top marketing channels
- Monitor check-ins and ticket types
Most importantly, take a close look at no-shows and attendance patterns across multiple days. If a large percentage of free ticket holders skipped the second day, it may be time to rethink your mid-event engagement approach.
2. Session Performance Metrics
Not every speaker captures attention in the same way, and this is where you find out who actually rocked the stage. Start by checking your total session attendance and see if you maxed out your room capacity.
- Compare attendance against room capacity
- Measure average session duration and attendee retention
- Review speaker ratings and written feedback
- Count the total volume of Q&A interactions
- Identify the most bookmarked sessions
If one track keeps pulling attendees back session after session, it often signals a high-interest topic worth expanding in next year’s event.
3. Attendee Engagement Metrics
Were attendees actively engaging throughout the event, or were they simply showing up and staying quiet? To find out, you need to pull your event app activity to measure attendee engagement metrics.
- Count private peer-to-peer meeting requests
- Track live poll responses and survey completions
- Measure chat participation and slide downloads
- Monitor mobile app logins and profile views
Do not forget to track content downloads, either. If hundreds of people saved a speaker’s presentation deck, you know that specific material was highly valuable. High engagement across these event analytics for conferences proves your crowd was genuinely locked in.
4. Marketing and Communication Metrics
Marketing performance is a crucial factor in your event analytics for conferences. Dig into your promotional data to see what worked best.
- Analyze email open and click-through rates
- Spot landing page conversion drop-offs
- Identify your highest-performing traffic sources
Pay close attention to campaign timing too, so you know exactly when your audience is most likely to click “buy.”
5. Sponsor and Exhibitor Metrics
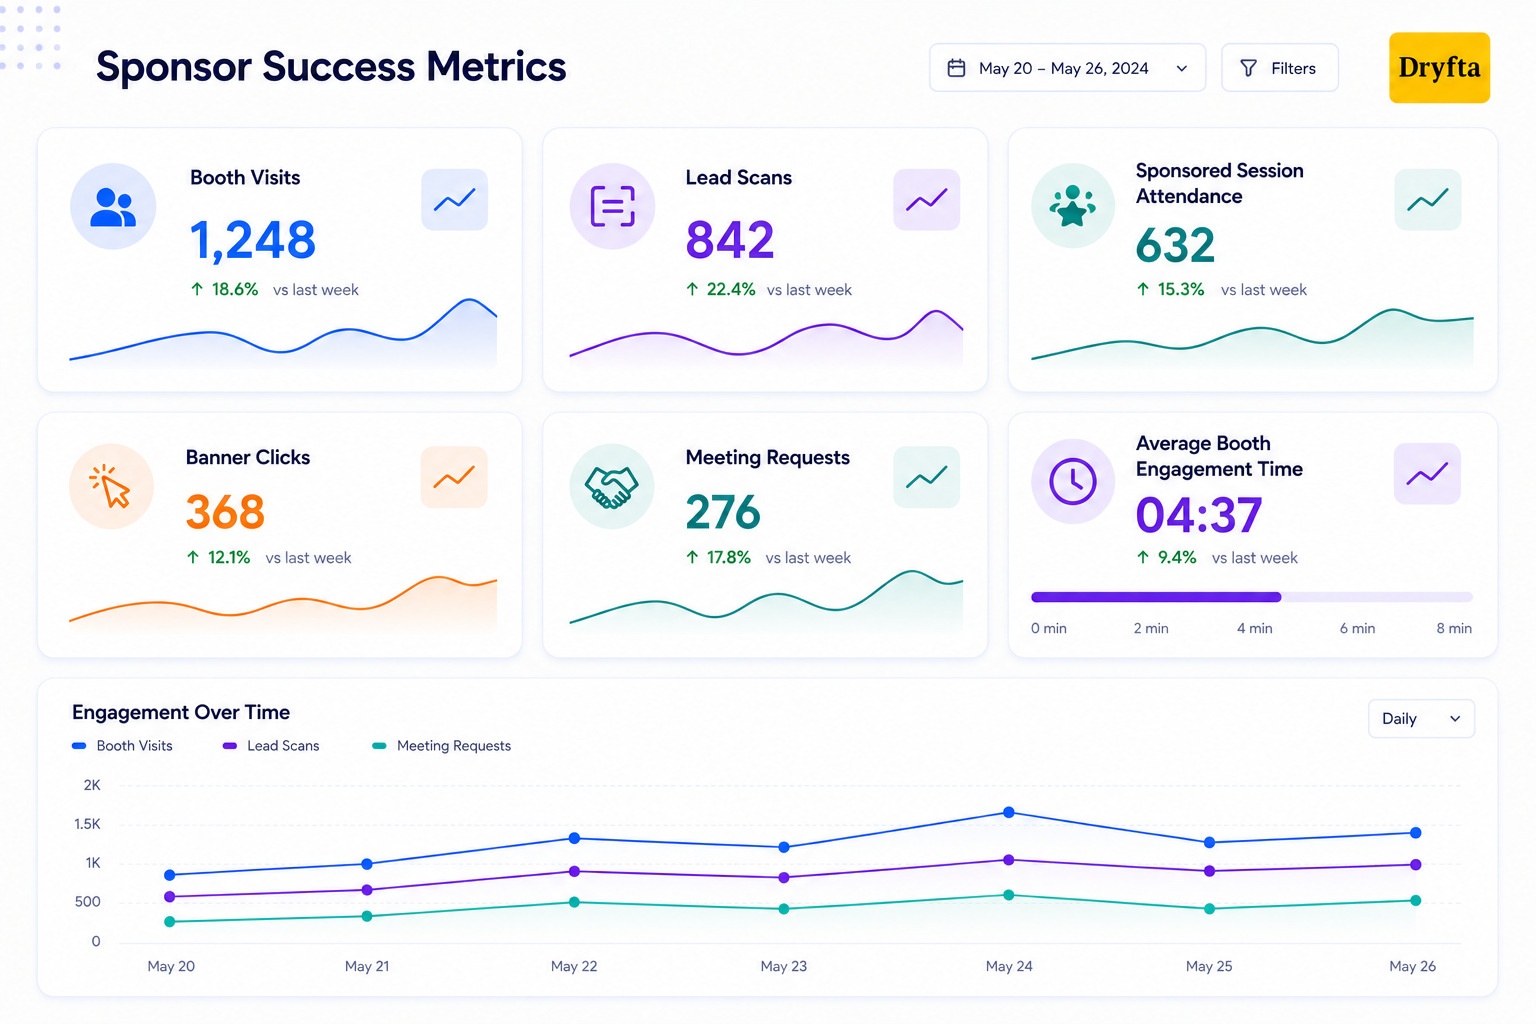
Your financial partners need proof that their investment was worth it. Here is what to show them:
- Total physical booth visits
- Digital profile and video views
- Hot lead scans captured by staff
- Average time spent at exhibitor booths
- Sponsored session attendance numbers
- Sponsor banner and advertisement clicks
- Meeting requests booked with exhibitors
Delivering high-quality post-event leads is the golden ticket to getting brands to sign up year after year. Sharing event performance metrics helps support renewal conversations with solid evidence.
6. Financial and ROI Metrics
Let’s talk about the bottom line. Combine your total ticket revenue and sponsorship revenue to calculate your gross income. From there, figure out your financial efficiency.
- Cost per individual attendee
- Overall marketing campaign ROI
- Revenue generated by specific audience segments
Regularly reviewing these financial metrics through event analytics for conferences helps maintain profitability and supports your growth decisions for future events.
How to Turn Event Analytics Into Improvements for Future Conferences?
Collecting data is essential, but it’s not the end of the process. The value of post-event analytics is when it aids in improving future events. Let’s look at how those insights can address some of the typical event planning issues.
- Improve Conference Agenda Planning: They’ve already told you what they care about. Looking at the attendance of sessions and the abstract topics gives you an idea of what topics should be given more visibility next year, and what topics can be eliminated.
- Optimize Session Timing and Room Allocation: Some sessions are full, others are not. Attendance trends will guide you in determining which presentations require more space, more time, or less competition from other presentations.
- Refine Speaker and Track Selection: Feedback from the audience on the speakers and the Q&A activity indicates which speakers and presentation styles were engaging and which tracks did not perform well. These lessons learned can help to improve the experience for attendees the next time you organize an event.
- Enhance Attendee Engagement Strategy: Understand how your audience wants to engage. Monitor app clicks, poll participation, networking metrics, and document downloads, and determine if your audience prefers digital networking tools or in-person interactions.
- Strengthen Event Marketing Campaigns: Don’t waste money on ineffective ads. Analyze your conference to see where your best ticket buyers have been coming from and optimize your next email blast and landing page design.
- Expand Sponsor and Exhibitor Value: Track booth visits, lead generation, interactions with sponsor content, and attendance at sponsored sessions to create sponsorship packages that better meet partner objectives.
When you use event analytics for conferences like this, you can be sure that your planning process is becoming more efficient each and every year.
How to Build a Post-Conference Analytics Review Process?
If you leave your event analytics unanalyzed, you miss the opportunity to turn insights into profitable action. A post-event review process helps transform raw numbers into a practical strategy and removes much of the guesswork from future planning. Let’s explore how to build a post-conference analytics review process.
Step 1: Define Goals Before Reviewing Data
A dashboard full of numbers does not mean much without a point of reference. Go back to your event goals and compare them against the actual results to see where expectations matched reality. If you don’t know what you were aiming for, your data can’t tell you if you hit the bullseye.
- Compare your final check-ins against your initial registration goals.
- Match your total ticket sales against your target financial budget.
- Evaluate attendee satisfaction scores against your past internal benchmarks.
- Measure financial returns for your top-tier corporate sponsors.
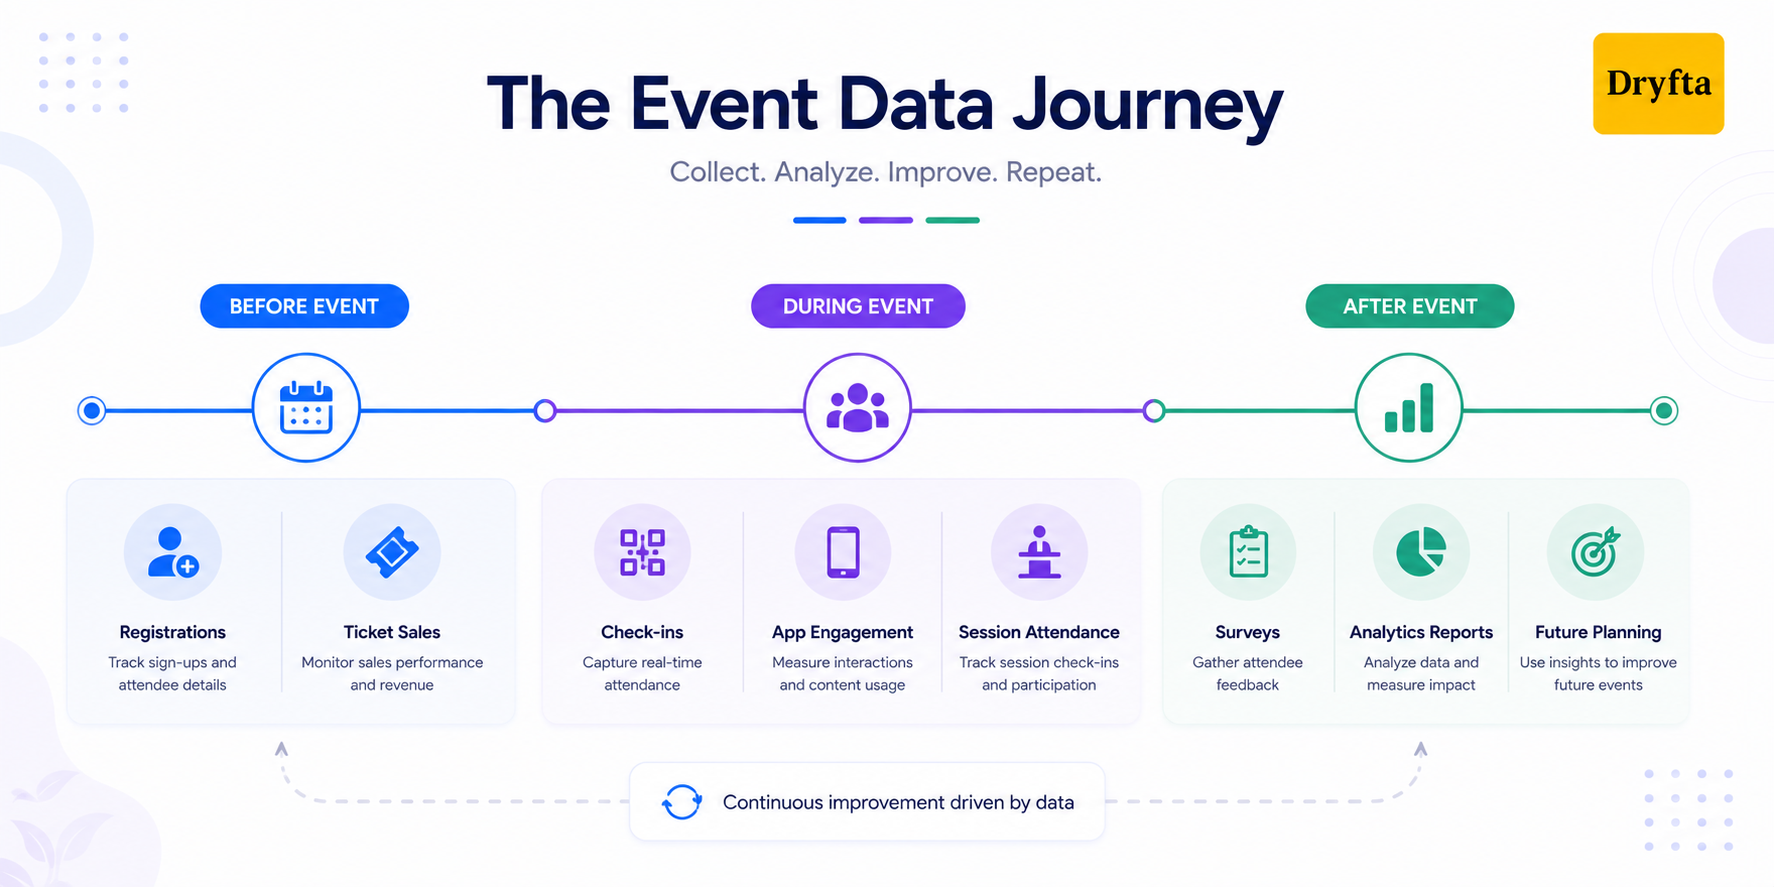
Step 2: Collect Data From All Event Touchpoints
To get the most accurate event performance metrics possible, combine data from registration platforms, event apps, surveys, and other attendee touchpoints. Missing even one piece of data can leave a blind spot in your final review.
Gather your information from across the entire event lifecycle:
- Online event registration and ticketing software databases
- On-site gate check-in logs
- Badge scanning apps
- Mobile event app dashboard
- Marketing email blast click reports
- Landing page traffic stats
- Post-event feedback forms
- Live session surveys
- Exhibitor lead generation portals
- Sponsored banner click trackers
Step 3: Separate Vanity Metrics From Decision Metrics
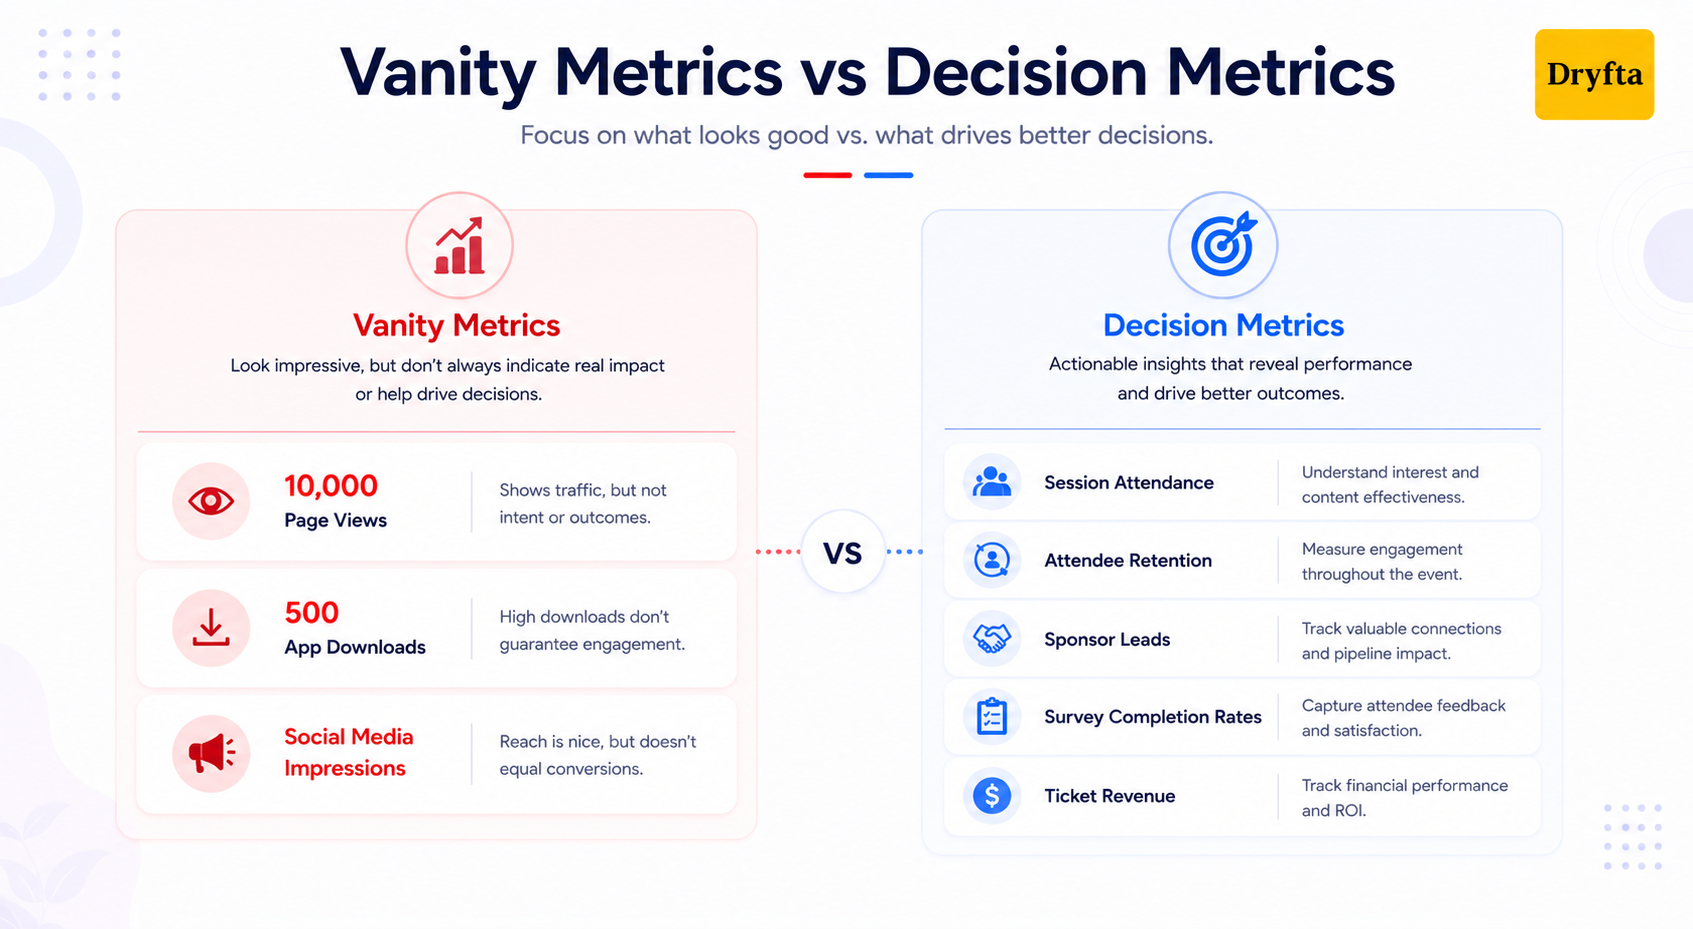
Here is a tough pill to swallow: some numbers only exist to make you feel good. We call these vanity metrics. For instance, seeing that your event page got 10,000 views or that your app was downloaded 500 times sounds amazing, right?
But guess what? Those numbers don’t mean a thing if those people didn’t actually show up or participate.
Event analytics for conferences connects your attendees’ actions to meaningful business outcomes. A high download count is completely useless unless it drives actual session engagement or revenue generation. Focus on the numbers that will directly impact your bottom line.
Step 4: Create a Post-Event Analytics Report
Once your numbers are in order, turn them into a document that is easy to scan and understand. Most stakeholders would rather review key insights than sort through spreadsheets themselves.
Your finalized report should include:
- An executive summary: A high-level overview of the entire event performance.
- Key wins: The specific areas where your team exceeded targets.
- Underperforming areas: The sessions or features that underperformed.
- Attendee insights: Behavioral trends discovered within the crowd.
- Sponsor results: Proof of the value delivered to financial partners.
- Recommendations: Concrete changes to implement for the next event.
Step 5: Convert Insights Into Action Items
Every insight you uncover should translate into a specific action for your next event. If your event analytics for conferences shows that morning attendance was shockingly low, do not just complain about it. Turn that insight into a rule: change the start time, offer better breakfast options, or move your headline speaker to a midday slot.
If the metrics show that people left a workshop 30 minutes early, your action item should be to shorten the session next time.
Step 6: Share Findings With Stakeholders
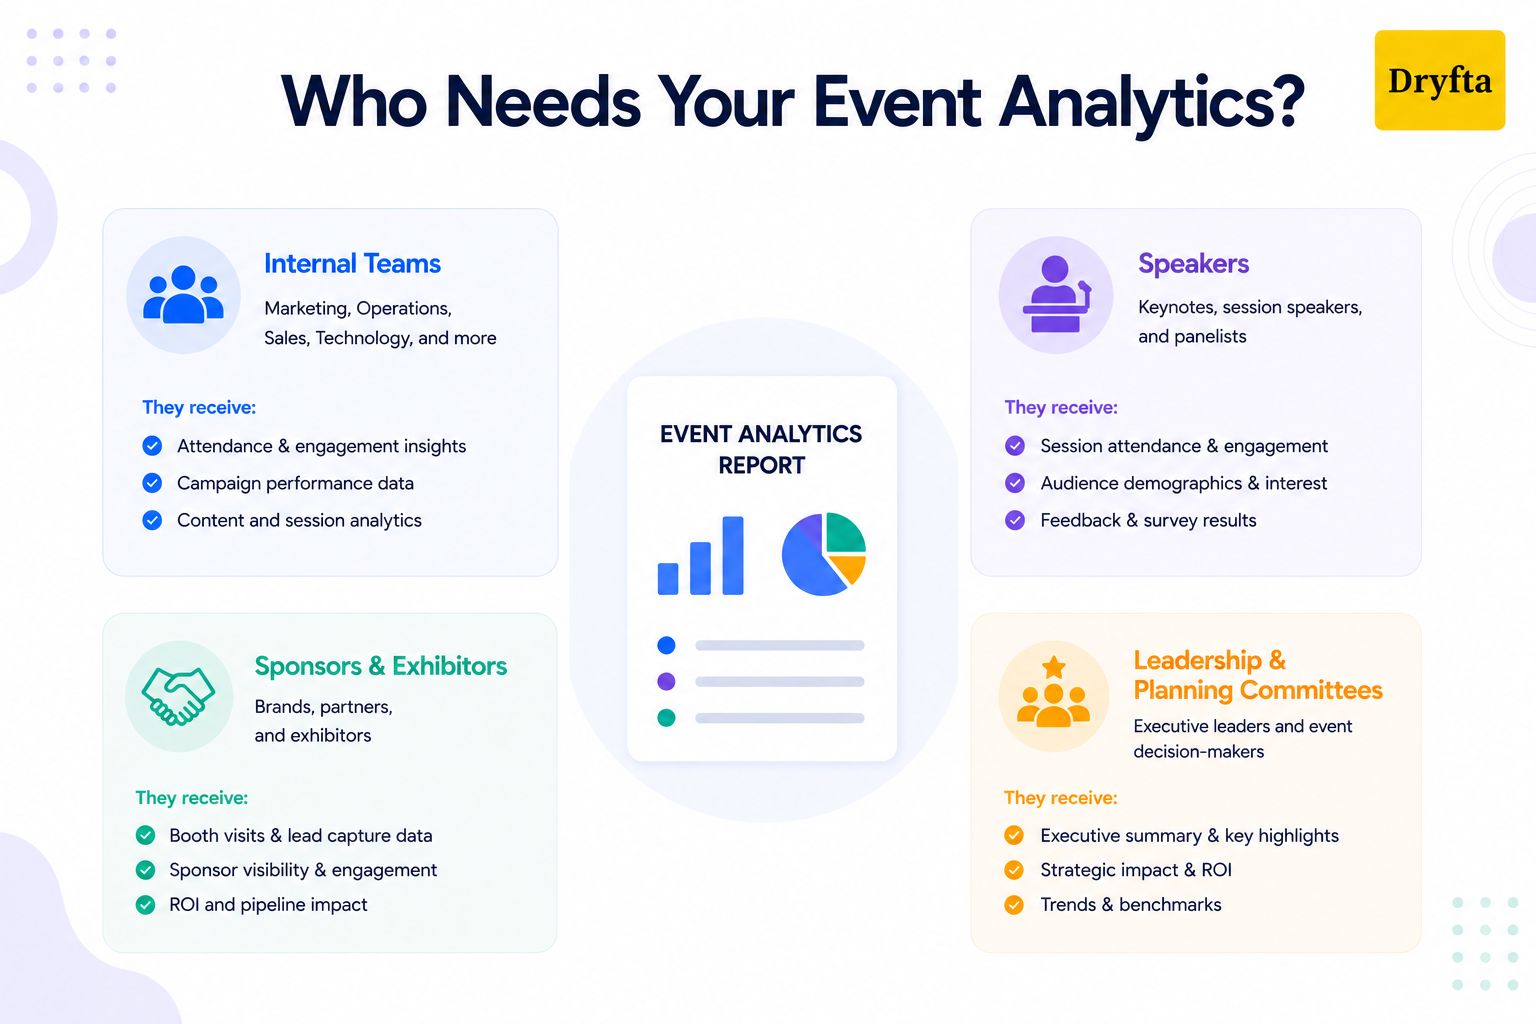
Sharing your post-event insights builds trust and helps your entire event community grow stronger.
Make sure to loop in:
- Internal teams: To celebrate wins and fix operational bugs.
- Speakers: To show them exactly how their presentations resonated.
- Sponsors and exhibitors: To prove they got amazing value for their money.
- Leadership and planning committees: To justify your overall budget spending.
Consistently practicing this review strategy turns event analytics for conferences into your organization’s ultimate competitive advantage.
Common Mistakes Organizers Make With Event Analytics for Conferences
A conference can generate a huge amount of data. The challenge is knowing what to do with it. Many teams focus on the wrong numbers and miss the insights that could drive better results. Before diving into your event analytics for conferences, watch out for these common mistakes.
- Only Looking at Total Attendance: A packed attendee list might feel like a win, but it does not automatically mean your event was successful. Headcount alone does not show if people actually stayed or just walked out early.
- Reviewing Data Too Late: Event analytics for conferences are most valuable when they are acted on quickly. Waiting weeks or months to review reports can make it harder to understand what happened and implement improvements while the event is still fresh in everyone’s mind.
- Keeping Data in Separate Tools: Event data is much harder to analyze when it is stored in multiple platforms. Registration numbers, email metrics, sponsor data, attendee engagement, and survey responses must be viewed together to get the most out of it.
- Ignoring Qualitative Feedback: Written comments often reveal what attendees loved, what was missing, and what they want to see next time. Ignoring that feedback means missing insights that can help shape a better event experience. It can highlight specific pain points that are easy to overlook when focusing only on quantitative metrics.
- Not Comparing Data Across Events: Event data becomes much more valuable when you compare it across multiple conferences. Tracking performance year over year can reveal opportunities that might not be obvious from a single event.
- Failing to Assign Ownership: Without a designated person or team responsible for acting on the findings, valuable recommendations can easily be overlooked.
How Dryfta Helps Organizers Use Analytics to Improve Future Conferences?
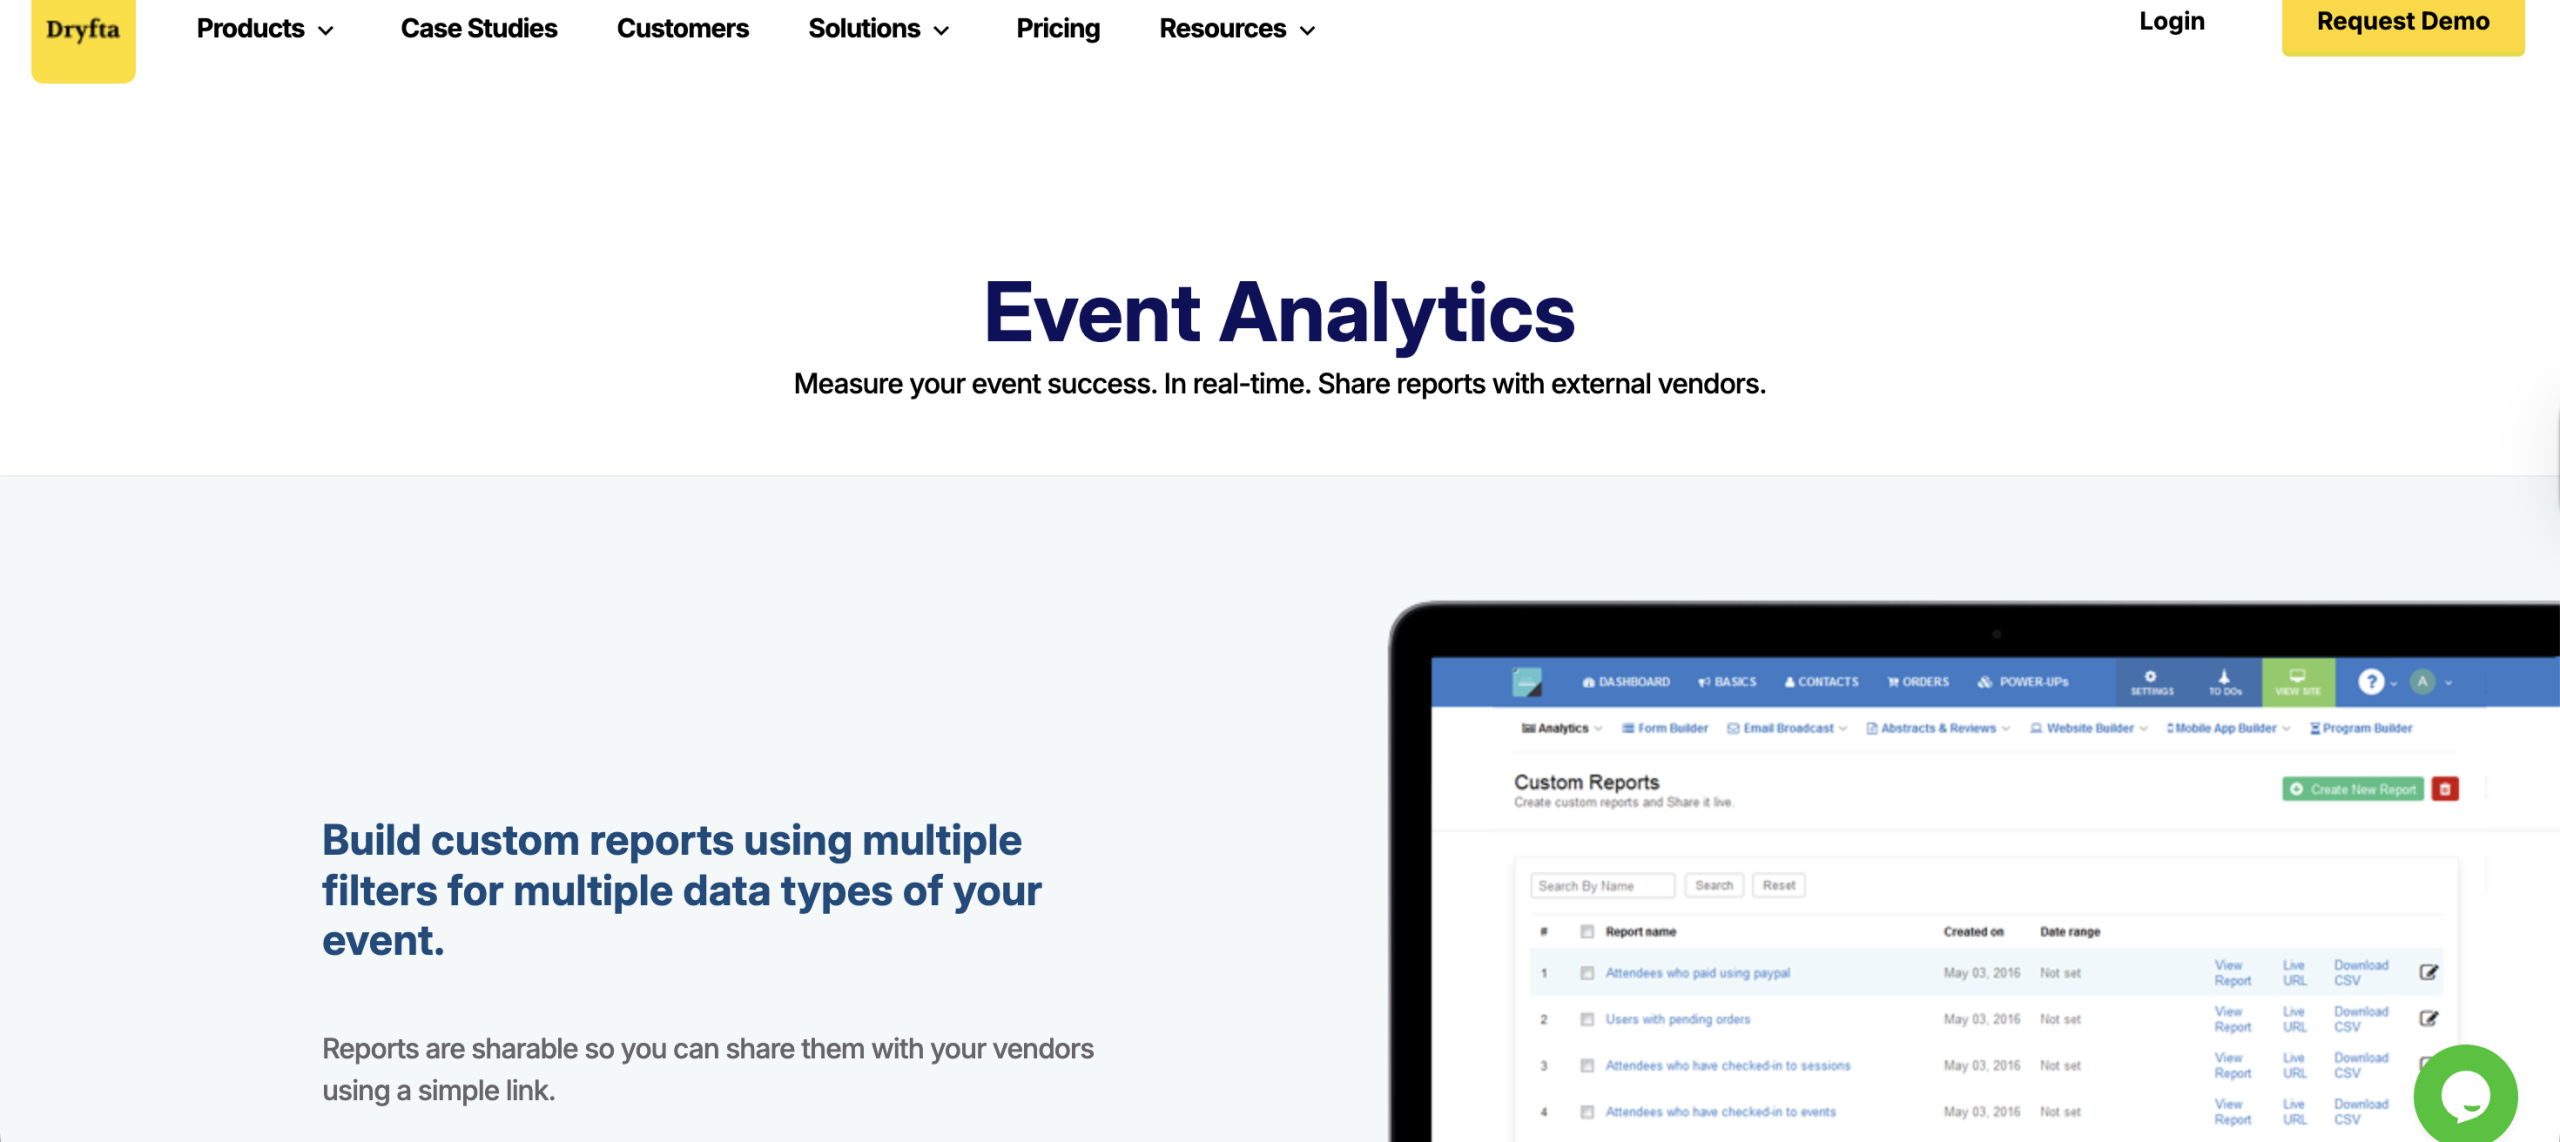
Your conference collects thousands of data points, but their value comes from bringing them together and understanding what they reveal. With Dryfta, all your event data stays within one platform, making post-event analytics far more useful.
Here is how Dryfta helps convert event data into actionable steps for future growth and improvement:
1. Centralized Conference Data
Reviewing event performance is much harder when your data is stored across multiple tools. Dryfta keeps everything connected, giving you one place to track registrations and attendee engagement. You can also manage abstract submissions, oversee peer reviews, monitor session schedules with event scheduling software, and access event reports without switching between separate platforms.
2. Real-Time Event Reporting
Reviewing event performance metrics after the event ends can leave you reacting too late. Dryfta helps you track activity in real time. You can spot a problem in the morning and fix it before the afternoon sessions even begin.
Dryfta gives you total control across the entire event timeline:
- Before: Track ticket sales spikes to adjust marketing budgets.
- During: Monitor badge scans to manage hallway crowds.
- After: Download final numbers instantly for stakeholder debriefs.
3. Session and Attendee Insights
Want to know what your audience actually thought of the keynote? Dryfta helps you see exactly how attendees interacted with each session, making it much easier to understand which parts of your program resonated most.
You can explore those insights through:
- Session check-ins: Precise headcounts at the door.
- Feedback loops: Instant star ratings and session reviews.
- Participation trends: Live Q&A and poll response rates.
4. Event CRM for Better Audience Segmentation
Dryfta features a powerful built-in event CRM that securely logs every interaction your guests make. The platform makes your future outreach feel incredibly personal and relevant.
With Dryfta, you can:
- Group your audience by specific roles
- Send personalized emails
- Boost your long-term member retention
5. Integrated Conference Workflows
Managing an event usually means handling registrations, speakers, abstract submissions and peer review, schedules, and attendee engagement all at once. Dryfta stores all those tasks together in one platform, helping reduce admin workload and simplify day-to-day event management.
6. Better Planning for the Next Conference
The ultimate goal of post-event analytics is to make your life easier next time around. Dryfta helps turn years of event information into practical insights that strengthen future planning through:
- Trend analysis: Tracking performance patterns across multiple events.
- Budget optimization: Focusing resources on what delivers results.
- Scaling growth: Replicating your highest-rated event formats.
The Bottom Line
Conference success does not come from guesswork. It comes from understanding what worked, what fell short, and what your attendees actually valued. Event analytics for conferences gives you the insights needed to improve every aspect of your conference, from agenda planning and attendee engagement to sponsor performance and budget allocation. The more consistently you review and apply those insights, the stronger your events become over time.
Dryfta makes that process easier by consolidating registrations, abstract management, speaker workflows, attendee engagement, and reporting into a single platform. Ready to make smarter event decisions with less effort? Book a free demo today and see how Dryfta can help you turn conference data into better event outcomes.
Frequently Asked Questions
1. What is event analytics in conference management?
Event analytics for conferences is the process of gathering and studying digital data across your entire event lifecycle. It combines information from ticket registrations, door check-ins, app engagement, and feedback surveys into a central dashboard. Event data analytics removes the guesswork from conference management.
2. How can event analytics improve future conferences?
Event analytics for conferences gives organizers a roadmap for future planning. Understanding what worked and what underperformed helps improve future conferences.
3. Which event metrics should conference organizers track?
Organizers must monitor event performance metrics across different factors. These include registration and attendance numbers, session performance, attendee engagement, marketing campaign conversions, sponsor lead generation, and overall financial ROI metrics.
4. How do you use post-event analytics for better planning?
Start by comparing your final numbers against your original event goals. Next, look for recurring behavioral trends, turn those insights into instructional updates for your operational checklists, and share the reports with your internal staff and sponsors to improve everyone’s performance.
5. Can event analytics help improve attendee engagement?
Absolutely. Engagement tracking features reveal exactly how your audience prefers to connect. You can use these insights to phase out boring, one-way lectures and introduce highly interactive formats that keep your audience engaged.
6. How can analytics improve sponsor and exhibitor value?
Corporate partners want proof that their investment was worth it and event analytics provides proof of return on investment. Metrics such as booth visits and sponsored session attendance help demonstrate the value to sponsors. Armed with that data, you can develop sponsorship packages that attract greater investment.
7. How does Dryfta help with conference analytics and reporting?
Dryfta centralizes your registration, ticketing, attendee communication, and session activity data into one unified dashboard. It provides real-time tracking before, during, and after your event. The platform tracks your metrics automatically in real time, giving your team visual cross-event dashboards to drive continuous conference improvements.