



Event data is only useful when it helps you make a decision. A registration total may tell you how many people signed up, but it does not explain which campaign brought them in, why some attendees did not check in, which sessions held their attention, or what sponsors gained from the event.
The best event analytics tools bring those signals together while there is still time to act. They help organizers monitor registration, attendance, engagement, revenue, and feedback without rebuilding every answer in a spreadsheet.
This guide compares 11 event platforms with built-in analytics. It shows where each one is strongest, what its reports can reveal, and what you should verify before choosing it.
Editorial note: Dryfta publishes this guide and is included in the comparison. We reviewed official product and help documentation available on September 23, 2026. We focused on practical reporting coverage, not the number of charts a vendor advertises. We did not run the same hands-on test on every platform, and features can vary by plan. Ask each vendor to demonstrate your reporting questions with realistic event data.
What makes an event analytics tool useful?
A useful dashboard should answer more than “How many people registered?” It should help your team understand what happened and decide what to do next.
- Before the event: Track registration pace, ticket sales, campaign sources, incomplete registrations, audience mix, and revenue.
- During the event: Monitor check-ins, room or session attendance, capacity, app activity, questions, polls, meetings, and exhibitor engagement.
- After the event: Compare registrations with actual attendance, review session performance, measure sponsor value, analyze feedback, and prepare reports for stakeholders.
- Across events: Spot trends, compare formats or audiences, and keep metric definitions consistent from one event to the next.
- Beyond the event platform: Send reliable data to your CRM, marketing system, finance tools, or business intelligence software when deeper analysis is needed.
The right level of reporting depends on the event. A paid workshop may need clear sales and attendance figures. A research conference may also need submission, reviewer, program, and session data. A large event marketing team may care most about account engagement, pipeline, and cross-event comparisons.
How we evaluated these event analytics tools
We looked at six questions that matter in day-to-day event work:
- Coverage: Does the platform report on registration, attendance, engagement, revenue, feedback, and sponsor activity?
- Speed: Which figures update during the event, and which reports arrive later?
- Depth: Can an organizer filter and compare the data, or only view a fixed summary?
- Sharing: Can reports be exported or shared securely with colleagues, sponsors, vendors, and leadership?
- Connections: Can event activity flow into a CRM, marketing platform, data warehouse, or analytics tool?
- Fit: Does the reporting match the events the platform is designed to run?
We gave more weight to answers an organizer can use than to impressive-sounding feature labels. “Real time” also deserves a closer look during a demo. Ask what refreshes instantly, what arrives after processing, and whether every user sees the same figures.
Event analytics tools at a glance
| Platform | Best fit | Reporting strength | Important consideration |
|---|---|---|---|
| Dryfta | Academic, association, nonprofit, and multi-track conferences | Connects registration, submissions, reviews, sessions, check-ins, CRM activity, and communication data | Confirm which custom reports and integrations your team will need before setup |
| Cvent | Large organizations managing complex event portfolios | Cross-event reporting, engagement data, revenue analysis, and executive reporting | Smaller teams should check whether the depth, setup, and total cost suit their program |
| Bizzabo | Enterprise event marketing and revenue teams | Registration, attendance, engagement, cross-event views, and CRM-connected reporting | Verify which custom reports, integrations, and advanced features are included in the proposed plan |
| Whova | Conferences that need attendee, sponsor, and post-event engagement reports | Live statistics plus polished post-event reporting that is easy to share | Check how much report customization is available before the final report is produced |
| RingCentral Events | Virtual and hybrid events with a strong video component | Live attendance views and reports for event areas, engagement, replay, and expo activity | Available analytics differ by event format |
| Accelevents | In-person, virtual, and hybrid events that need engagement reporting | Registration, session, speaker, exhibitor, sponsor, and cross-event analysis | Account-level reporting and some capabilities may depend on the package |
| Eventbrite | Ticketed public events, classes, workshops, and recurring events | Clear sales, attendee, ticket-type, campaign, and check-in reporting | Complex conferences may need deeper session, sponsor, or content reporting elsewhere |
| Swapcard | Conferences and trade shows focused on networking and sponsor value | Registration, session, meeting, connection, content, and exhibitor engagement metrics | Detailed exports and add-on reports can depend on the selected plan |
| Airmeet | Virtual and hybrid programs built around live participation | Real-time views of attendance and online engagement with downloadable reports | Reporting coverage varies by event format, so test the format you will use |
| Zoho Backstage | Organizations already using Zoho or seeking accessible event tools | Sales, registration, attendance, session, affiliate, and website analytics | Advanced analysis may require a paid tier or a connection to Zoho Analytics |
| Eventzilla | Ticketed events that need flexible registration reports and GA4 tracking | Custom order and attendee reports plus registration-funnel data in Google Analytics | Teams may move between Eventzilla and GA4 for a complete marketing view |
11 best event analytics tools for 2026
1. Dryfta
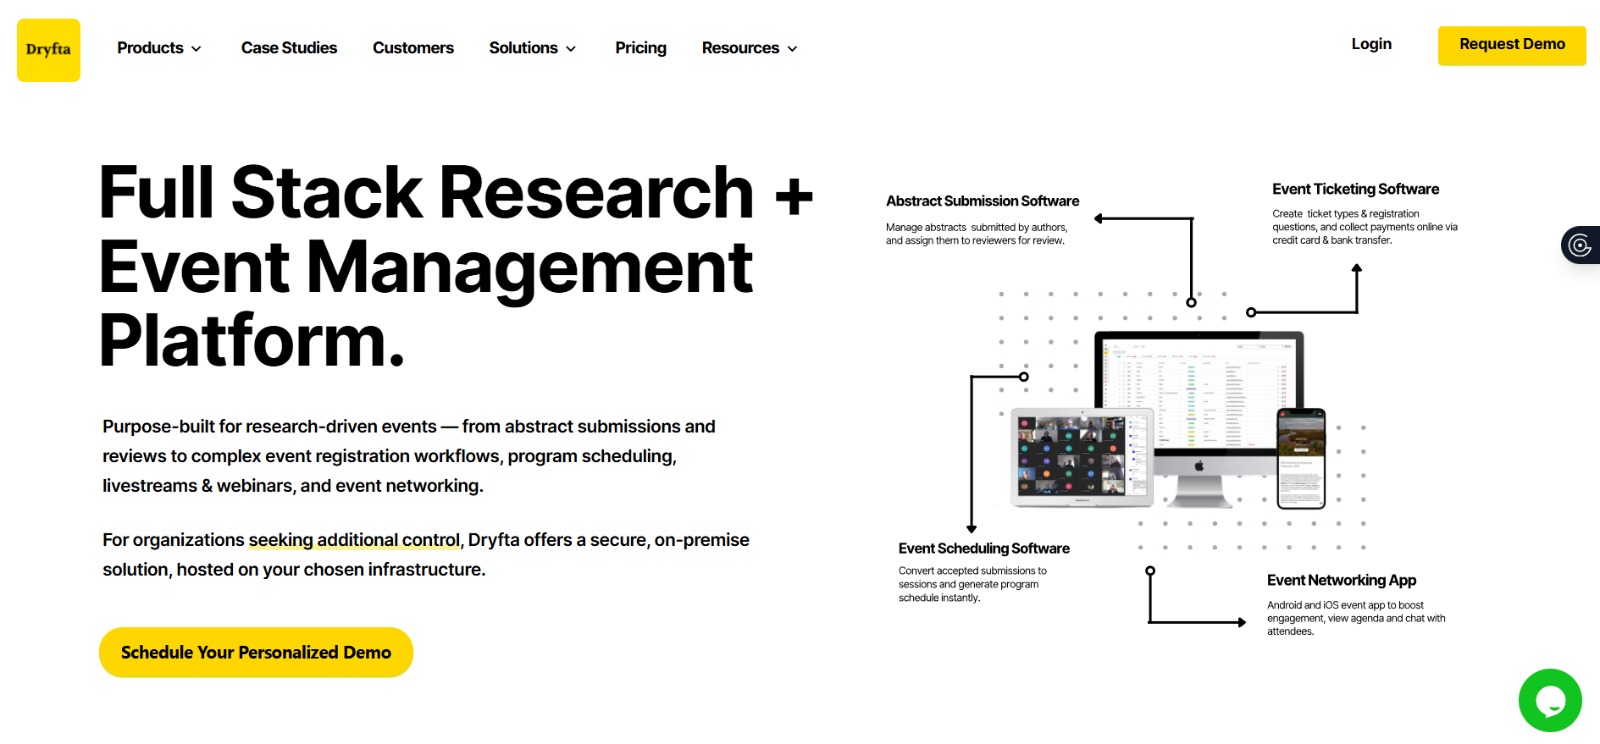
Dryfta is a strong fit when an event has more moving parts than registration and ticket sales. Academic conferences, associations, and nonprofits can track contacts, registrations, payments, abstract submissions, reviews, program activity, session check-ins, email engagement, and attendee behavior without treating each workflow as a separate data source.
The event snapshot gives organizers a quick view of current activity, while saved and custom reports support closer analysis. Reports can be filtered, exported, and shared securely with stakeholders who do not need full platform access. Teams can also build contact segments from report criteria and use them for targeted communication.
This connected model is useful when the same person may be an attendee, author, reviewer, speaker, donor, or sponsor contact. Simpler ticketed events may not need that breadth, but complex conferences benefit from having one record behind the numbers. See how Dryfta’s event analytics and reporting works across the platform.
2. Cvent
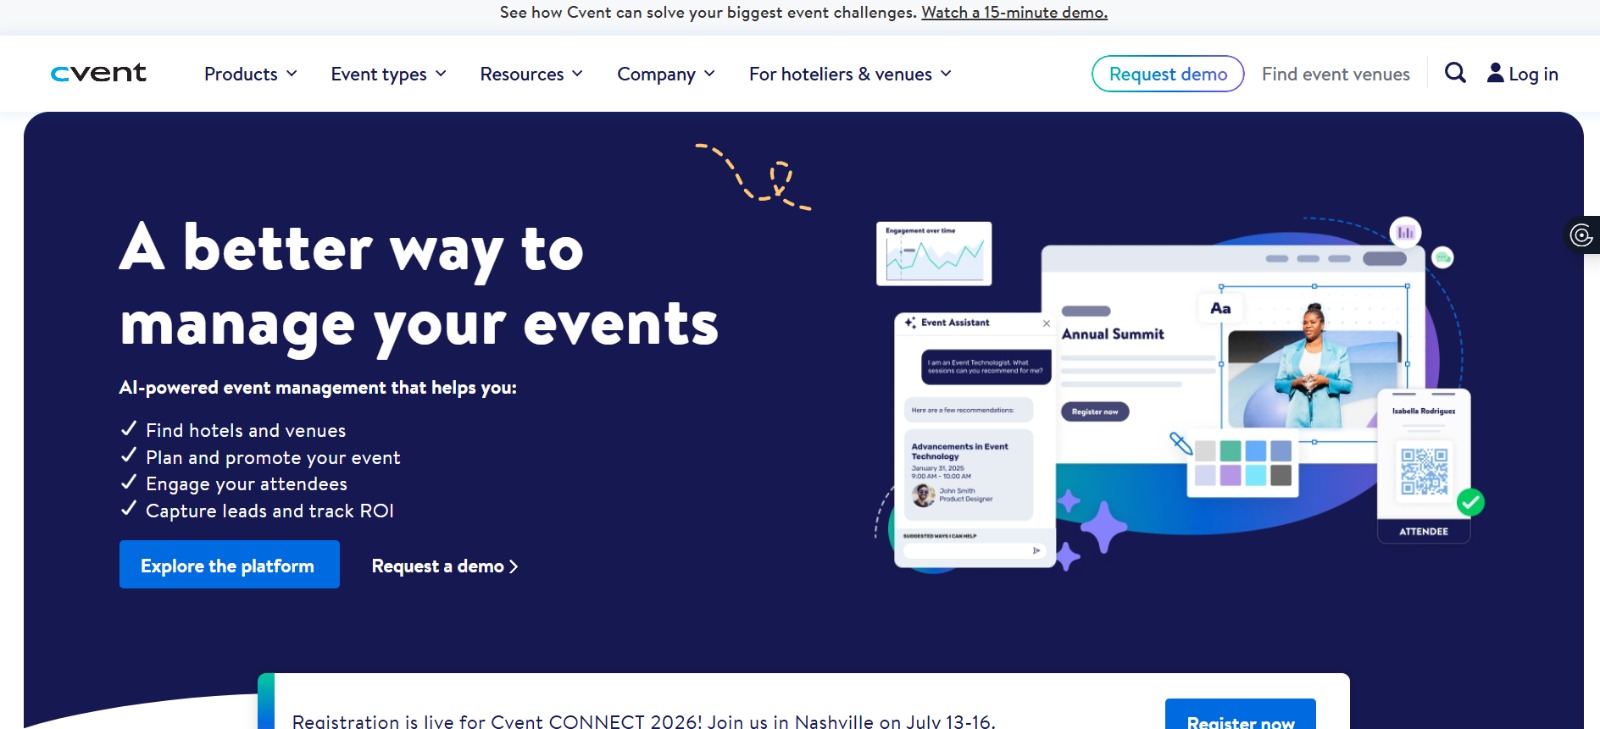
Cvent is designed for organizations that run large or varied event programs and need a common reporting framework. It can bring registration, check-in, session participation, engagement, feedback, revenue, and CRM data into event and cross-event views. Teams can build reports, compare performance across regions or event types, and prepare summaries for leadership.
That depth is most valuable when an organization has dedicated event, marketing, operations, and analytics roles. A smaller team running a few straightforward events should examine how much configuration and training its reporting plan requires. It should also ask which advanced services sit outside the standard package.
3. Bizzabo
Bizzabo suits event marketing teams that want to connect event behavior with sales and marketing follow-up. Its centralized dashboards cover metrics such as registrations, check-ins, session attendance, ratings, app adoption, and networking activity. Cross-event views help teams look beyond one conference and identify patterns across a wider program.
The platform becomes more useful when event data flows into systems such as Salesforce, HubSpot, Marketo, or Microsoft Dynamics. Buyers should map that data flow during the demo and confirm which connectors, APIs, and custom reports are part of the quoted plan.
4. Whova

Whova makes reporting approachable for conference teams that need to explain event performance to a committee, board, sponsor, or exhibitor. Organizers can follow ticket sales, check-ins, polls, surveys, app use, networking, session interest, and sponsor impressions. Its post-event report packages much of that activity into a presentation-ready summary.
The ready-made format can save time, especially for teams without an analyst. If your stakeholders require unusual formulas or highly tailored dashboards, ask Whova to show how far you can change the standard views and which data you can export for separate analysis.
5. RingCentral Events
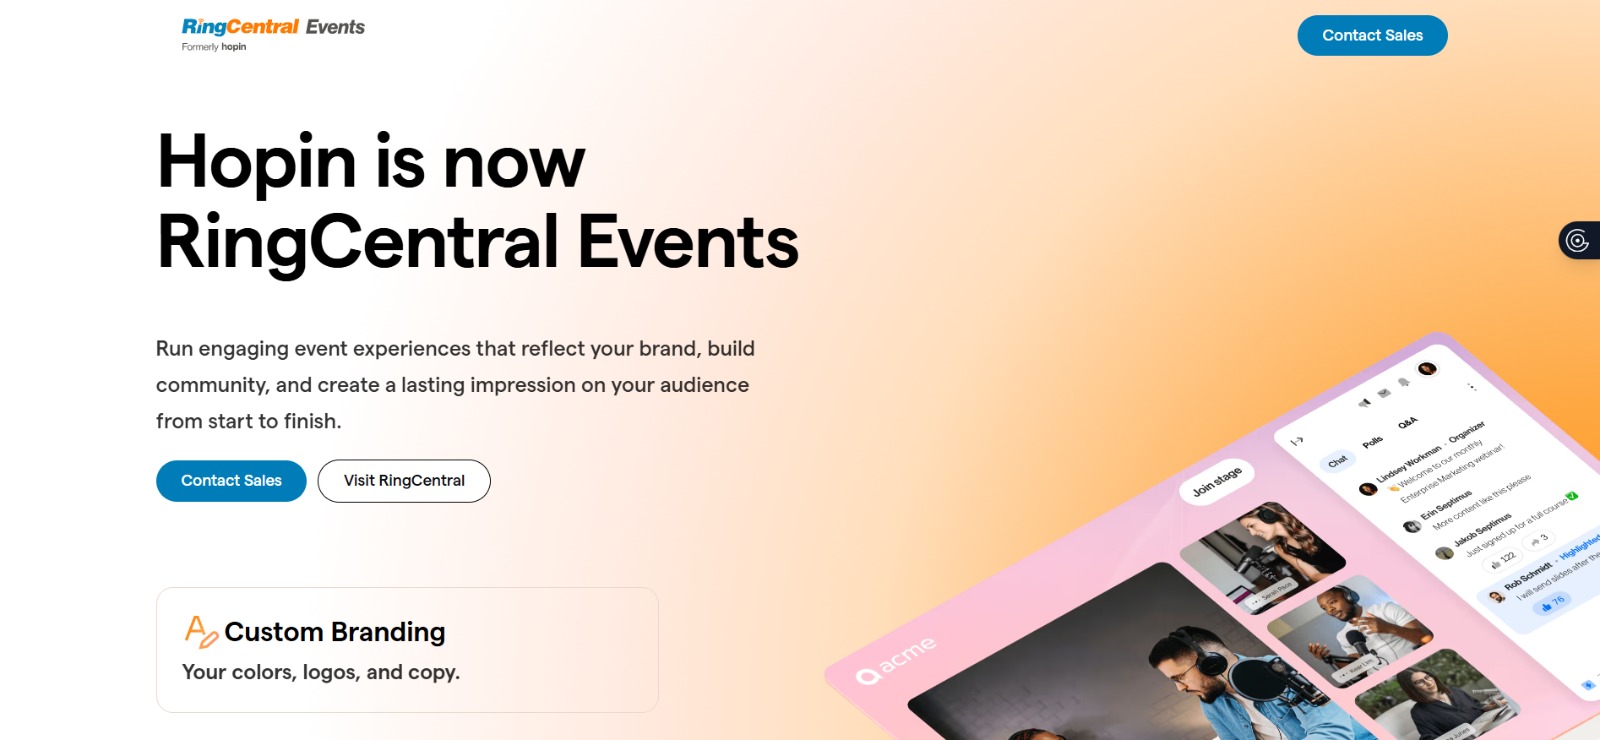
RingCentral Events, formerly Hopin Events, is a natural option for video-led virtual and hybrid programs. Its live dashboard shows attendance over time and activity across event areas. Downloadable reports cover people and attendance, engagement, replays, and expo activity, which helps organizers understand how attendees moved through the online experience.
Reporting varies across webinar, virtual, hybrid, and onsite formats. Do not rely on a generic feature list if your program uses more than one format. Ask for a demonstration of the exact dashboard, refresh behavior, and exports available for each event type you plan to run.
6. Accelevents
Accelevents offers real-time views across registration, ticket sales, sessions, speakers, sponsors, exhibitors, surveys, and attendee interaction. Organizers can review one event or compare activity across several events, then export data for follow-up and deeper analysis.
This makes the platform worth considering for teams that run a mix of in-person, hybrid, and virtual events. The reporting scope is broad, so focus the buying conversation on the reports your team will use every week. Confirm whether account-level transaction reporting, custom views, and cross-event analysis are included in your package.
7. Eventbrite

Eventbrite keeps the reporting close to the needs of ticketed public events. Its dashboard shows sales, revenue, ticket-type performance, attendee location, marketing sources, and live check-in progress. Organizers can view one event or compare several events over a chosen period, then group, filter, and export the results.
For a class, fundraiser, performance, or recurring local event, that clarity may be more useful than an enterprise reporting suite. A multi-track conference should check whether it also needs detailed session, sponsor, exhibitor, abstract, or learning data that falls outside Eventbrite’s ticketing-centered view.
8. Swapcard
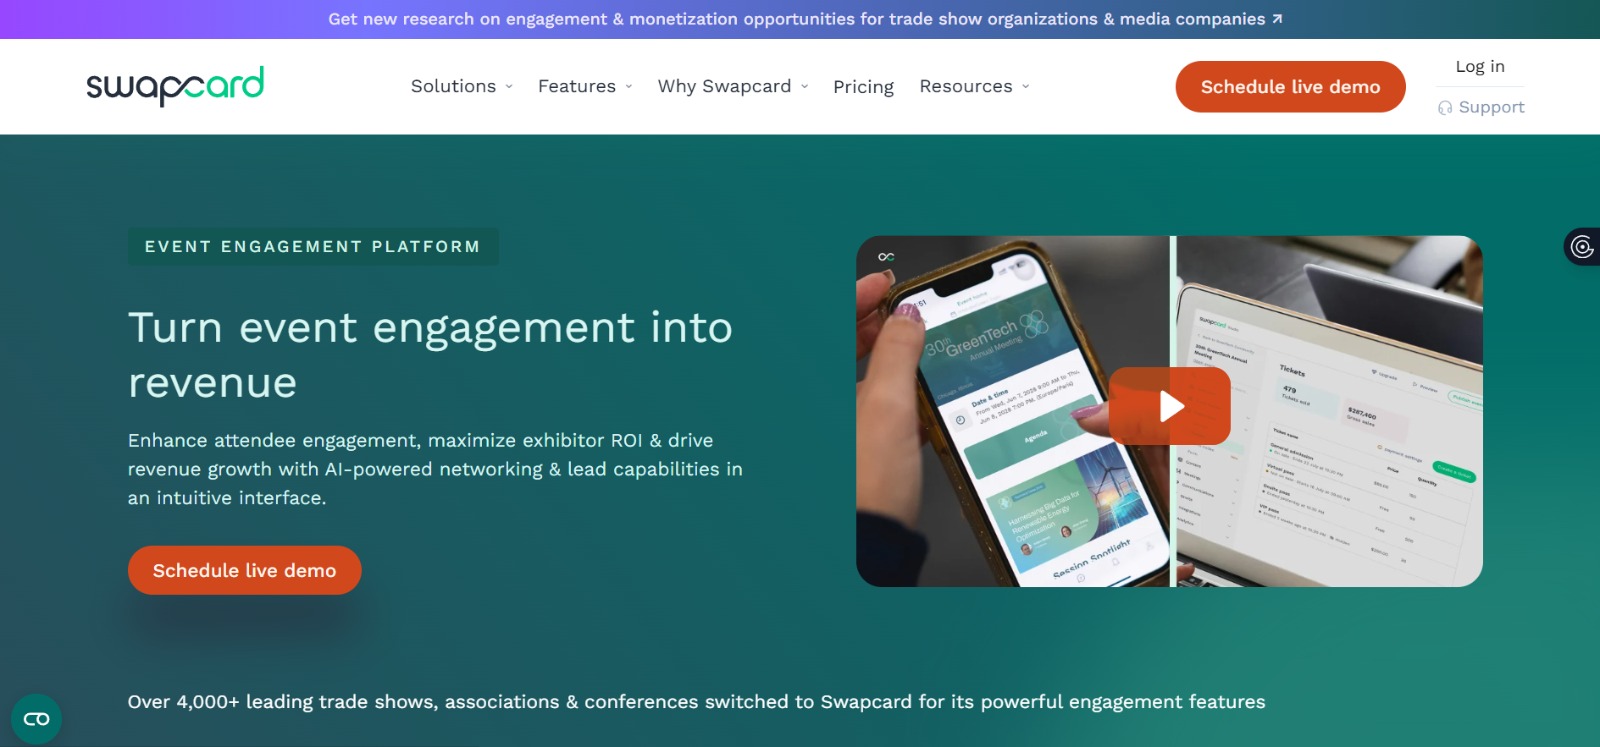
Swapcard goes deeper into the attendee interactions that matter at conferences and trade shows. Its live dashboard can show registrations, check-ins, active users, session attendance, meetings, connections, badge scans, bookmarks, page views, and other content activity. Exhibitor and sponsor reports help teams turn those interactions into evidence of value.
The dashboard is designed for nontechnical users, while APIs and webhooks support more advanced data flows. Some detailed exports, lead reports, and onsite scanning reports depend on the plan or add-ons, so put every required report into the proposal before comparing prices.
9. Airmeet
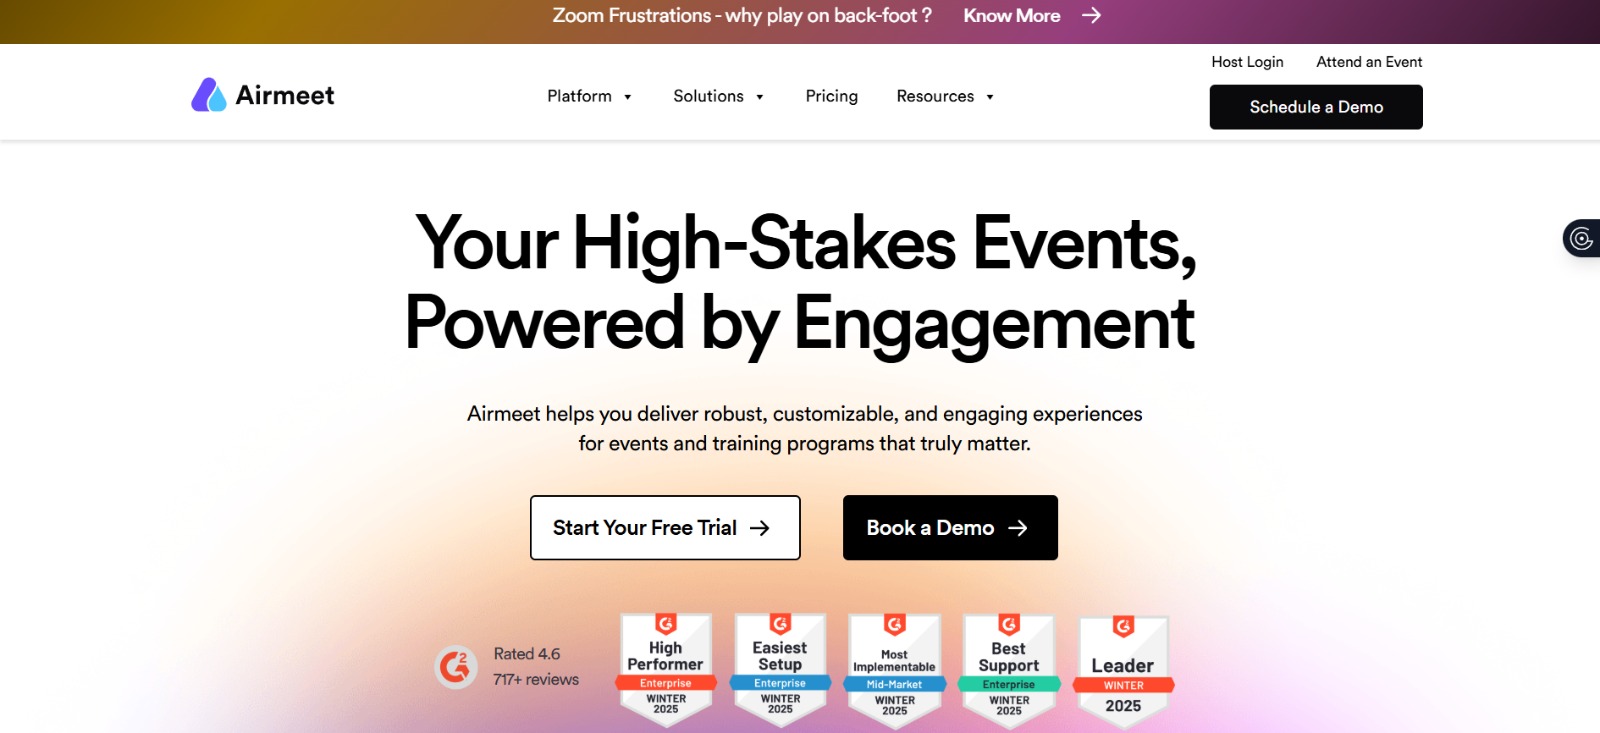
Airmeet is built around live online participation, which makes its analytics most relevant to virtual and hybrid programs. Organizers can review attendance and engagement while an event is underway, then send or download more detailed reports for their team.
The available fields depend on the event format. That matters if you run webinars, multi-session conferences, and hybrid meetings under one account. Test the reporting for each format and ask how quickly data appears after the event begins. A team with heavy onsite needs should also make sure the platform captures the physical interactions it wants to measure.
10. Zoho Backstage
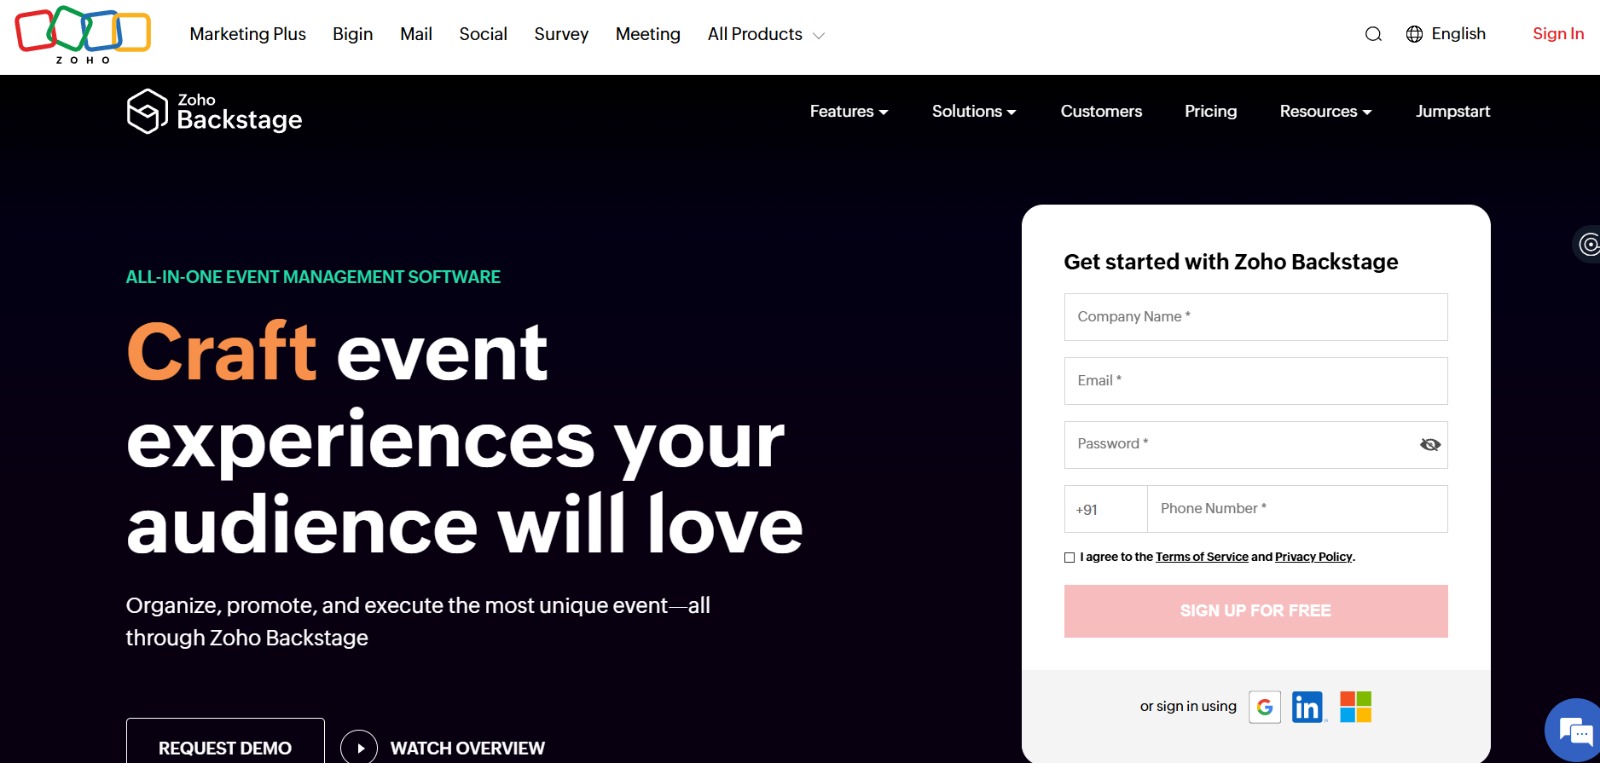
Zoho Backstage covers sales, revenue, ticket types, promo codes, registration drop-off, affiliate performance, attendance, and session response. Its organizer app also provides a live summary of ticket sales, registrations, check-ins, and revenue, which is handy when the event team is away from a desk.
Organizations already using Zoho can extend the analysis through Zoho Analytics and combine Backstage data with other business sources. That is useful, but it also means buyers should separate what Backstage reports by itself from what requires a paid tier, an add-on, or another Zoho product.
11. Eventzilla
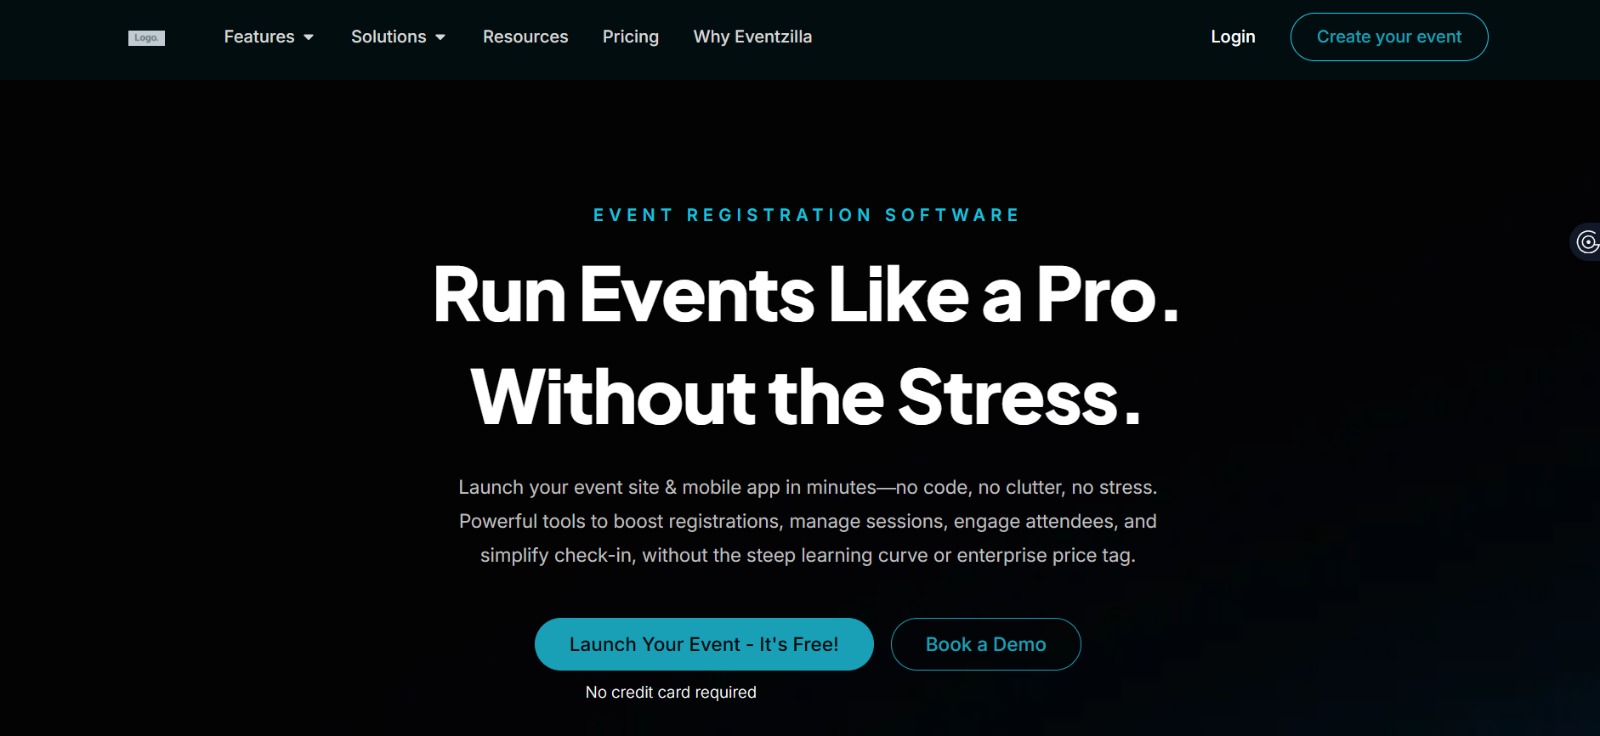
Eventzilla combines registration reporting with Google Analytics 4 tracking. Organizers can create order, attendee, and custom-question reports, schedule report generation, and watch registration activity from the event overview. The GA4 connection sends events from page views through registration and payment steps, which helps marketing teams study conversion behavior.
This setup works well when a team already uses GA4 and wants event registration data inside its wider website measurement. It also means that some answers live in Eventzilla while others live in Google Analytics. Decide who will own that setup and reporting before the event launches.
How to choose the right analytics tool for your events
Start with decisions, not dashboards
Write down the decisions your team expects to make before, during, and after the event. You may need to change a campaign when registrations slow, open an overflow room when a session fills, follow up with highly engaged attendees, or show a sponsor exactly what its investment produced. A report earns its place when it supports one of those actions.
Check that the platform captures the whole event journey
Registration numbers alone cannot explain the attendee experience. Look for a connected view of invitations, registrations, payments, check-ins, sessions, app activity, meetings, feedback, and follow-up. For academic or association events, include submissions, reviews, speakers, and program activity in that map.
Ask what “real time” means
Some dashboards refresh within seconds. Others update every few minutes or only after a report is generated. The difference matters most for capacity, check-in, livestream, and engagement decisions during the event. Ask the vendor to change a record in a test event and show when it appears in the dashboard.
Test the handoff to other systems
Your event platform does not need to replace every analytics tool. It does need to move clean, well-defined data to the systems that use it. Check field mapping, update frequency, duplicate handling, consent, error logs, API limits, and the cost of each connector.
Compare the report you receive, not the feature list
Give every shortlisted vendor the same reporting brief. Ask each one to build a registration report, a live attendance view, a session-performance report, and a stakeholder summary. This reveals more than a checklist because you can see the filters, steps, limits, and output for yourself.
Questions to ask during the demo
- Which dashboards update during the event, and how often?
- Can we compare events, audiences, ticket types, sessions, and marketing sources?
- Can staff create reports without vendor support or technical knowledge?
- Can we share a live report without giving someone full platform access?
- Which exports, integrations, APIs, and scheduled reports are included in our plan?
- How does the platform define attendance, engagement, conversion, and ROI?
- How long is raw and aggregated data retained?
- What happens to our historical reports if we change plans or leave the platform?
Frequently asked questions
How do event analytics tools work?
They collect and organize information about registration, attendance, engagement, revenue, feedback, and other event activity. This helps organizers understand performance and make decisions before, during, and after an event.
Which event metrics matter most?
The right metrics depend on the event’s goals. Common measures include registration conversion, attendance rate, ticket revenue, session attendance, app adoption, meeting activity, sponsor leads, survey response, satisfaction, and cost or revenue per attendee. Choose a small set tied to decisions rather than tracking every available number.
Do I still need Google Analytics if my event platform has reports?
Often, yes. Built-in reports are usually better for registration, attendee, session, and operational data. Google Analytics adds website journeys, traffic sources, campaign context, and cross-domain behavior. The two are most useful when their event names and conversion definitions agree.
Can event analytics measure ROI?
They can provide much of the evidence, including revenue, attendance, engagement, leads, meetings, and sponsor activity. A complete ROI calculation may also need event costs, sales pipeline, donations, membership changes, or other outcomes held in financial and CRM systems.
What is the best event analytics tool for conferences?
There is no single best choice for every conference. Dryfta is particularly well suited to academic, association, and nonprofit conferences that need submissions, reviews, registration, scheduling, attendee records, communication, and reporting in one system. Video-led events may favor RingCentral Events or Airmeet, while enterprise marketing programs may prefer Cvent or Bizzabo. The best fit is the platform that can answer your event’s real reporting questions without unnecessary manual work.
Turn event data into better decisions
A good analytics platform does not merely produce more numbers. It gives the right person a trustworthy answer while there is still time to use it.
Before choosing a tool, bring one real event, four reporting questions, and a sample stakeholder request to the demo. Ask the vendor to show the complete path from activity to report. You will quickly see which platform fits your team and which one leaves important gaps.
If your conferences connect registration with submissions, peer review, scheduling, session attendance, communication, and attendee history, request a Dryfta demo. We will show how those workflows feed one reporting system and help you build the views your team actually needs.