



ROI or return on investment is a key marker for event planners when it comes to a plethora of considerations. It is the numbers that yield as ROI that will ultimately decide the future course of your organization. Show the returns must shown, more than told.
What Event ROI Actually Means
Ask five event professionals to define ROI and at least two will describe something that is not actually ROI. Revenue is not ROI. Attendance is not ROI. Even profit, the plain dollar gain after costs, is not the same thing as the percentage return that ROI specifically measures.
| Metric | What It Measures | Why It Gets Confused With ROI |
| Revenue | Total money produced by the event | Ignores cost entirely, so a high number can still be a loss |
| Profit | Revenue minus total cost | Shows the dollar gain but not the efficiency of the investment |
| ROAS | Revenue produced per dollar of marketing spend | Covers marketing cost only, not the full event budget |
| ROO | Progress against stated goals, financial or not | Useful but not interchangeable with a dollar-based figure |
| Event ROI | Net financial return as a percentage of total cost | The only one that answers whether the event was worth the investment |
Attendance alone deserves particular skepticism, even though headcount often becomes the headline number in a post-event recap. A sold-out room says nothing about whether the event produced enough attributable value to justify what it cost to run. Treating attendance, revenue or general participation as a stand-in for event ROI is exactly the shortcut that makes a report look strong in a slide and fall apart the moment a finance team asks a direct follow-up question.
To find your event ROI quickly & easily, use this formula:
Event ROI (%) = (Attributable event value − Total event cost) ÷ Total event cost × 100
Choose the Outcome You Are Actually Measuring
Before any formula gets applied, a team needs to agree on which outcome the event was actually built to produce. A paid conference, a pipeline-building B2B event, an academic gathering, a fundraiser, and a community program each point toward a different primary metric, and no single event ROI formula fits all five equally well. A university calculating conference ROI is answering a fundamentally different question than a demand generation team calculating event marketing ROI for a sponsored trade show booth.
| Objective | Primary Outcome | Supporting Indicators |
| Generate revenue | Attributable gross profit and ROI | Revenue per attendee; conversion rate |
| Build pipeline | Event-sourced or influenced pipeline | Qualified leads; meetings; opportunities |
| Paid conference | Ticket and sponsor margin | Registration conversion; attendance |
| Education | Learning or behavior change | Assessment improvement; completion |
| Association growth | Membership revenue or retention | Renewals; new members; participation |
| Fundraising | Net funds raised | Donor acquisition cost; repeat gifts |
| Community | Retention and participation | Connections; meetings; repeat attendance |
Matching the metric to the actual goal prevents a common failure mode, where a team measures qualified leads for an event that was never designed to generate leads in the first place, then wonders why the resulting ROI number looks unconvincing to anyone reviewing it. Choosing the right primary outcome before the event begins makes every calculation that follows far easier to defend later.
Calculate Financial ROI
With the right outcome identified, the actual math stays refreshingly simple. Three calculations cover almost every financial conversation a team will need to have about a given event.
Event profit equals attributable revenue minus total event cost, and this figure answers a basic question: did the event make or lose money in absolute terms. Event ROI percent equals that same numerator, attributable value minus total cost, divided by total cost and multiplied by one hundred, and this is the number that answers how efficient the investment actually was relative to its size. Return ratio equals attributable value divided by total event cost, expressing the same relationship as a multiple rather than a percentage.
That last formula is where most reporting errors creep in. A 3 to 1 return ratio means three dollars returned for every dollar invested, and it sounds like it should translate cleanly into 300 percent ROI. It does not. Once the original dollar of cost gets subtracted out, exactly as ROI requires, the actual net return works out to 200 percent rather than 300. Confusing a return ratio with an ROI percentage overstates performance by a full hundred points, and this single mix-up accounts for a surprising share of every event ROI figure that turns out wrong. Running the numbers using an event ROI calculator, rather than doing this conversion by memory under deadline pressure, catches the mistake before it reaches a slide.
Ratio warning: a 3 to 1 return ratio means $3 returned for every $1 invested. Once the original $1 cost gets subtracted, net ROI works out to 200%, not 300%.
Count the Complete Investment
An ROI calculation is only as honest as the cost figure sitting underneath it, and most event budgets undercount costs in fairly predictable ways.
- Direct event costs: venue, catering, production and travel
- Allocated staff labor across planning and delivery
- Technology and platform fees
- Payment processing charges
- Fulfillment costs for printed or shipped materials
- Post-event nurture and follow-up costs
- Refunds issued
- A reasonable estimate of opportunity cost
Skipping any single category on that list does not make the event cheaper. It simply makes the reported event ROI wrong in the direction that flatters whoever is presenting it, and that gap tends to surface eventually, usually at the least convenient moment in front of finance.
Measure the Complete Return
Financial return is only one layer of what an event actually produces, and treating every kind of value as interchangeable dollars is exactly how event ROI reporting loses credibility over time. A complete set of event ROI metrics separates return into four layers rather than blending everything into a single inflated figure.
- Direct revenue: ticket sales, sponsorship, on-site purchases and donations already closed
- Commercial outcomes: pipeline sourced or influenced by the event, not yet closed
- Participation outcomes: attendance, session participation, meetings completed, survey response
- Long-term impact: retention, renewals, learning outcomes and mission-specific results that surface months later
The editorial rule worth repeating throughout this guide matters more than any single formula in it: never combine revenue, pipeline, participation and sentiment into one inflated number. Report realized financial ROI, future commercial value and nonfinancial event ROI outcomes as three distinct layers, and resist the temptation to assign an arbitrary dollar value to something like NPS or a meeting count simply to make the final number look larger. That kind of monetization only holds up when a documented historical model genuinely supports the conversion, and most organizations do not have one sitting ready to use.
Attribute Revenue Without Overstating It
Attribution decides how much credit an event actually deserves for a given piece of revenue, and getting this step wrong is where even a mathematically correct ROI calculation can still end up misleading.
| Model | Use When | Caution |
| Event-sourced | The event created the contact or opportunity | Misses influence on existing opportunities |
| First-touch | The event began the journey | Overcredits early discovery |
| Last-touch | The event immediately preceded conversion | Undervalues earlier interactions |
| Equal multi-touch | Several documented touches contributed | Assumes every touch had equal weight |
| Weighted multi-touch | Reliable journey data and agreed weights exist | Complex and sensitive to the weighting model |
| Event-influenced | The event touched an active opportunity | Must be kept separate, never merged with sourced or realized revenue |
Choosing among these six models is not a formality. The event-sourced model only credits revenue where the event genuinely created the contact or the opportunity, which understates influence on deals that were already active before the event took place. Event-influenced attribution takes the widest possible view, crediting the event for touching an active opportunity, but that breadth is precisely why influenced pipeline needs to stay in its own category rather than blending into realized revenue. A conference reporting its full influenced pipeline as closed revenue has not measured event ROI. It has inflated it.
Finance teams respond far better to precise language than to a single blended number. Use attributable closed revenue for realized value, weighted pipeline for forecast value still moving across the funnel and event-influenced pipeline for the broadest possible view of the event’s relationship to a deal. Keeping these three terms distinct, both in the written report and in the follow-up conversation, is what earns an event ROI figure lasting credibility with the finance team reviewing it.
Before, During and After: The Measurement Calendar
Measurement does not start on the morning of the event, and it certainly does not stop the day the event ends. A complete measurement calendar spans the planning stage across to 180 days after the doors close.
| Window | What to Capture |
| Before launch | Objective, baseline, target, cost categories, attribution model, measurement window, ownership |
| Promotion | UTMs, registration source, landing-page conversion, email and referral performance |
| Registration | Profile, organization, role, consent, ticket, campaign ID, interests, baseline survey |
| During event | Check-ins, session attendance, meetings, polls, Q&A, sponsor interactions, onsite revenue |
| Day 1 to 3 | Satisfaction, NPS, learning, content follow-up, urgent issue resolution |
| Day 7 to 14 | Lead qualification, meeting results, membership interest, donor follow-up |
| Day 30 | Opportunities, memberships, donations, renewals, cost reconciliation |
| Day 60 to 90 | Pipeline movement, conversion, retention indicators, content reuse |
| Day 180 | Closed revenue, long-cycle outcomes, final ROI, portfolio comparison |
Ownership matters just as much as timing. The event team typically owns goals, costs, attendance and operational data. Marketing or revenue operations usually owns campaign identifiers, CRM hygiene, attribution and pipeline conversion. Finance validates costs, recognized revenue and margin assumptions. A programme or mission owner tracks learning, membership, community or fundraising outcomes specific to that event’s actual purpose.
Agreeing on the attribution model, the cost inclusions and the reporting window before the event begins stands out as the single best practice in this entire guide, since changing any of those three things once results arrive undermines the credibility of the whole report.
The Event ROI Formula Library
Sixteen formulas cover nearly every question a team will need answered across a typical event lifecycle, spanning acquisition efficiency during promotion across to long-term loyalty measured well after the event closes.
| Metric | Formula | What It Answers |
| Event profit | Attributable revenue minus total event cost | Absolute gain or loss |
| Event ROI % | (Attributable value minus total cost) / total cost x 100 | Efficiency of the investment |
| Return ratio | Attributable value / total event cost | Gross return per $1 invested |
| Attendance rate | Attendees / registrations x 100 | Show-up effectiveness |
| Registration conversion | Registrations / landing-page visitors x 100 | Page or campaign effectiveness |
| Cost per registration | Registration marketing spend / registrations | Acquisition efficiency |
| Cost per attendee | Total event cost / actual attendees | Delivery efficiency |
| Revenue per attendee | Event revenue / attendees | Commercial yield per participant |
| Cost per qualified lead | Event cost / qualified leads | Lead acquisition efficiency |
| Lead-to-opportunity rate | Opportunities / qualified event leads x 100 | Lead quality and follow-up |
| Meeting completion | Completed meetings / booked meetings x 100 | Networking or sales execution |
| Session participation | Session check-ins / eligible attendees x 100 | Program participation |
| Survey response | Completed surveys / survey recipients x 100 | Confidence in feedback data |
| Donor acquisition cost | Fundraising event cost / new donors | Fundraising efficiency |
| Membership conversion | New memberships / qualified attendees x 100 | Association growth |
| Repeat attendance | Returning attendees / eligible past attendees x 100 | Loyalty and community value |
Treat this library as a reference worth returning to across planning and reporting rather than a single-use worksheet filled out once and filed away. A formula that answers acquisition efficiency during promotion carries far less weight once the event is underway, when session participation and meeting completion start telling the more relevant part of the story.
Build the ROI Dashboard
A single ROI percentage tells one story to one audience. A useful event ROI dashboard needs at least three separate views, since an executive, an event team and a sponsor are each asking a slightly different question about the same event.
| View | Recommended Measures |
| Executive | Cost, realized value, ROI, sourced pipeline, influenced pipeline, objective progress |
| Event team | Registration funnel, attendance, sessions, meetings, satisfaction, cost variance |
| Sponsor or stakeholder | Qualified interactions, completed meetings, content participation, agreed lead quality, satisfaction |
Underneath those three views, the underlying data itself should stay separated into three visible categories rather than blended into one dashboard tile.
| Realized | Future Value | Nonfinancial |
| Closed-won revenue | Sourced pipeline | Attendance and sessions |
| Ticket and sponsor revenue | Influenced pipeline | Meetings and connections |
| Donations received | Probability-weighted pipeline | NPS and satisfaction |
| Net event profit and ROI % | Open renewals or memberships | Learning or mission impact |
Keeping realized revenue, future value and nonfinancial outcomes in visibly separate panels is what lets each audience trust the specific number they are actually looking at. An executive reviewing sourced and influenced pipeline side by side with realized ROI can see both the current return and the pipeline still in motion without mistaking one for the other.
Common Event ROI Mistakes
A handful of recurring mistakes explain why so many event ROI figures do not survive contact with a skeptical finance team.
- Reporting profit as if it were an ROI percentage
- Counting full pipeline value as realized revenue
- Leaving allocated staff labor out of the cost register entirely
- Measuring only in the days right after the event and stopping there
- Switching attribution models mid-cycle once results start looking weak
- Treating every positive number as though it counts as event ROI
- Assigning an invented dollar value to NPS, impressions or learning outcomes with no supporting model
- Quoting an industry benchmark with no traceable source or comparable measurement method
Most of these mistakes share a common root. Someone under pressure to report a strong number reaches for the broadest possible definition of return, and that shortcut works right up until a finance team, a board member or a sponsor asks one clarifying question the number cannot survive.
How Dryfta Supports Event ROI Measurement
None of the measurement discipline covered so far requires specialized software in principle, but capturing accurate registration, attendance, session and survey data consistently, across every event a team runs, is where most organizations actually struggle without a connected system in place.
| Measurement Layer | Evidence to Capture | Dryfta Capability |
| Revenue and costs | Ticket, workshop, sponsorship, donation, order, invoice and budget data | Registration and ticketing |
| Attendee records | Registration details, tickets, purchases, activity, communications and session attendance | Event CRM |
| Actual attendance | Event and session check-ins | Guest and session check-in |
| Program participation | Session attendance, personalized schedules, polls, chat, Q&A and downloads | Scheduling and event app |
| Feedback and learning | Post-event responses, satisfaction, learning and objective-specific surveys | Survey management |
| Reporting | Custom reports, filters, event snapshots, sharing and CSV export | Event analytics |
| Downstream attribution | CRM, analytics, email, payments and connected workflows | Partners and integrations |
Dryfta brings registration revenue, attendee profiles, event and session check-ins, meetings, surveys and custom reporting into one event workflow, giving organizers a consistent data foundation for measuring financial ROI, participation and longer-term outcomes. Connected CRM and analytics workflows support the downstream attribution work covered earlier in this guide, rather than leaving that reconciliation to a manual export process once the event has already closed.
Teams evaluating their current setup can see how registration and ticketing, session check-in data, survey management and connected partners and integrations fit into one measurement workflow, rather than remaining scattered across separate tools that someone has to reconcile by hand after every event.
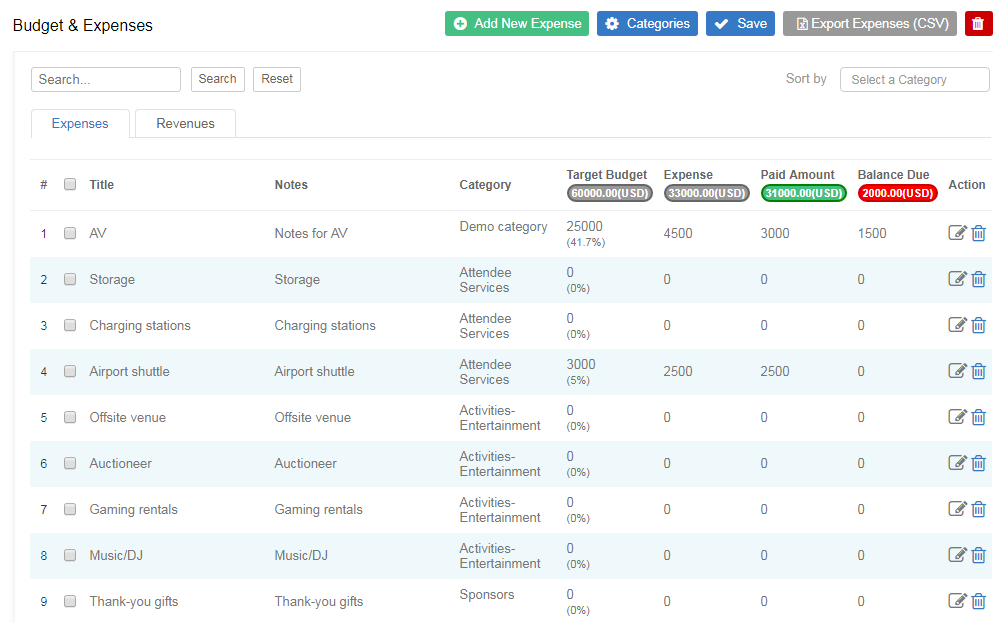
To add and manage your budget, you should use a full-fledged budget management tool to manage & calculate your revenues & expenses. Using Dryfta’s budget management tool, you can add revenues & expenses for your event and let Dryfta calculate your event’s return on investment. For more intensive data collection, you can also create separate categories for both revenue and expense items, add notes, set target budget and actual expenses for each item.
Save time
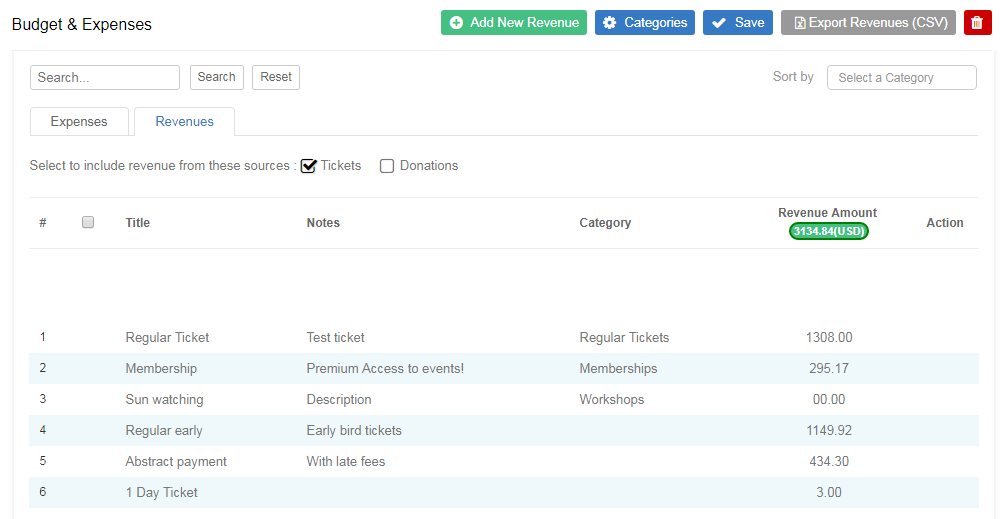
Save time with quickly exporting all revenues generated from ticket sales and donations to your budget management tool. Dryfta budget management tool comes with the option to include default revenue sources including different type of tickets that was purchased i.e. Workshop tickets, Memberships, Abstract fees, Registration tickets, and Donations. On selecting these revenue sources, system creates ticket groups as categories and ticket types as revenue items.
Visual Snapshot
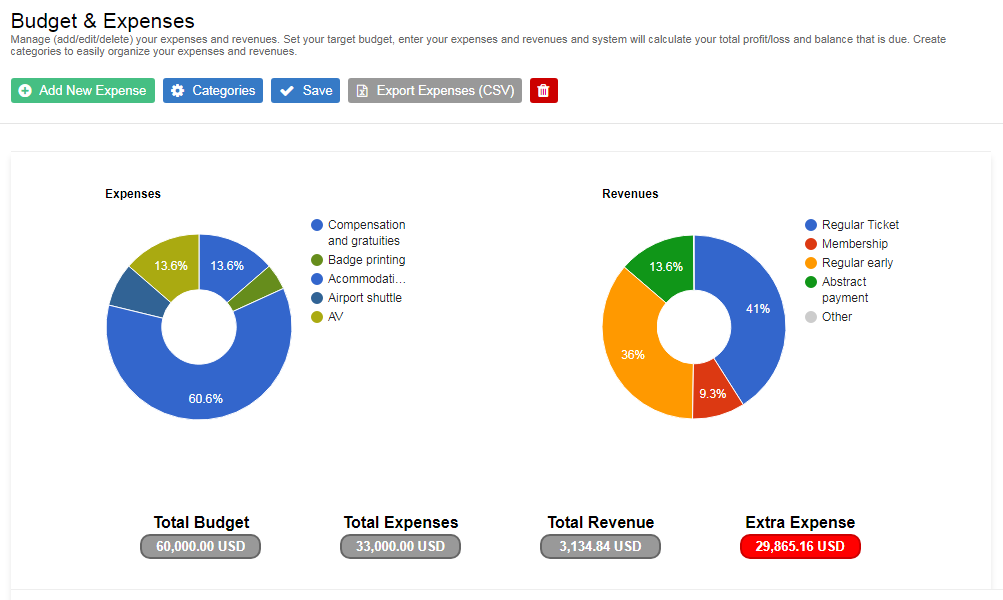
Get a quick visual snapshot of your budget by comparing your revenues and expenses visually using the pie-charts stacked together side by side. Need to download your revenue and expenses data to your Excel sheet? Simply click on Export button to download the latest copy of your expenses and revenues in CSV format.
To see the latest features added and improvements made to the Dryfta event platform, go to our System Status page.
Dryfta offers a free trial account for 30 days to all universities and non-profits to try the platform with up to 30 free registrants.
Frequently Asked Questions (FAQs)
What is the formula for event ROI?
Event ROI percent equals attributable event value minus total event cost, divided by total event cost, multiplied by one hundred. An event producing 120,000 dollars in attributable value against a 50,000 dollar cost returns an event ROI of 140 percent.
What costs should be included in an event ROI calculation?
A complete cost figure includes direct costs such as venue and production, allocated staff labor, technology fees, payment processing, fulfillment, post-event nurture costs, refunds and a reasonable estimate of opportunity cost. Leaving any of these out inflates the reported ROI beyond what actually happened.
How do you attribute revenue to an event?
Attribution should follow one of six documented models: event-sourced, first-touch, last-touch, equal multi-touch, weighted multi-touch or event-influenced. The model should be chosen and written down before the event begins, since switching models once results arrive undermines the credibility of the report.
When should event ROI be measured?
Measurement should begin before promotion starts and continue across at least 180 days after the event closes, since commercial pipeline and long-cycle outcomes such as renewals or major gifts often take months to fully resolve.
How do nonprofits measure event ROI?
Nonprofits should separate net funds raised, donor acquisition cost and repeat gift rate out of broader mission outcomes such as awareness or programme learning, since folding mission impact into a single financial ROI figure tends to obscure both.
What is the difference between ROI and ROO?
Event ROI measures financial return as a percentage of cost. Return on objectives measures progress against whatever the event was actually built to achieve, which may be financial but is just as often educational, mission-driven or community-focused. The two measure different things and belong in separate reports rather than merged into one figure.
Is there a reliable event ROI benchmark?
Any benchmark cited should come with a traceable original source and a measurement method comparable to the one being used internally. Event ROI figures calculated with different cost inclusions or attribution models are not actually comparable to each other, no matter how similar the reported percentages happen to look side by side.
How should event ROI be reported to stakeholders?
Reporting works best across three separate views: an executive view showing realized ROI alongside pipeline still in motion, an event-team view covering funnel and operational performance and a sponsor or stakeholder view focused on qualified interactions and agreed lead quality. Each audience should see the event success metrics that actually matter to their decision, not one blended figure trying to satisfy everyone at once. A post-event ROI report built around these three views tends to hold up far better under questioning than a single summary slide ever does.